There is no more important time for health organizations to use all of the data available to them than in a health crisis. The data can help health officials stay informed, but it can also help inform a response – where and how to intervene. As a result, the care that is being provided can improve and lives can be saved.
The way that data is presented can also make a difference. Many different organizations are using visualizations of the current coronavirus that allow the data be viewed and understood more easily in order to improve the response. Here are some of the data visualizations of the COVID-19 pandemic that can help everyone stay informed, from those worried about whether the virus will affect them to the health officials trying to stop it.
Overview of global cases
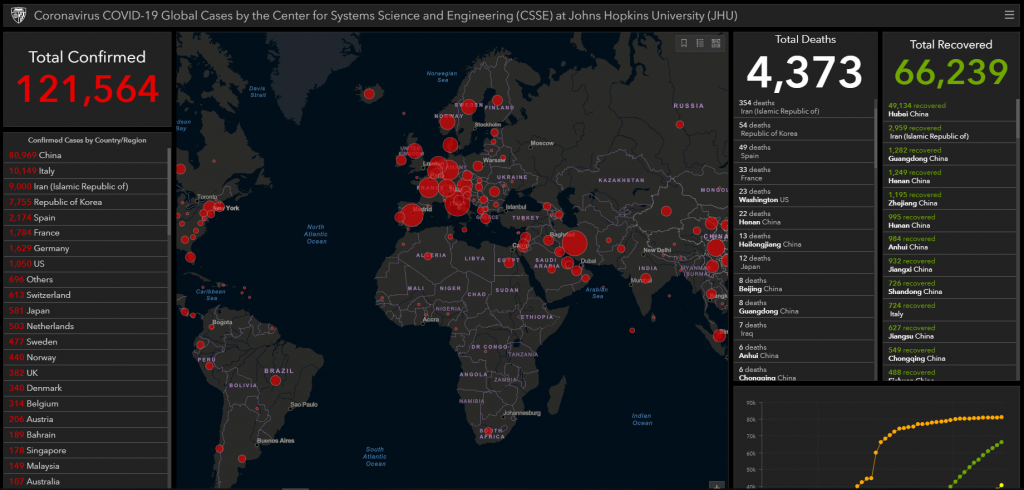
Johns Hopkins University’s Center for Systems Science and Engineering has put together the most comprehensive data visualization of the coronavirus, mapping the outbreak in real time. It shows the number of cases, deaths, and recoveries, and maps them all. The site also includes links to a mobile version of the map as well as a link to other resources about the virus.
Tracking the spread
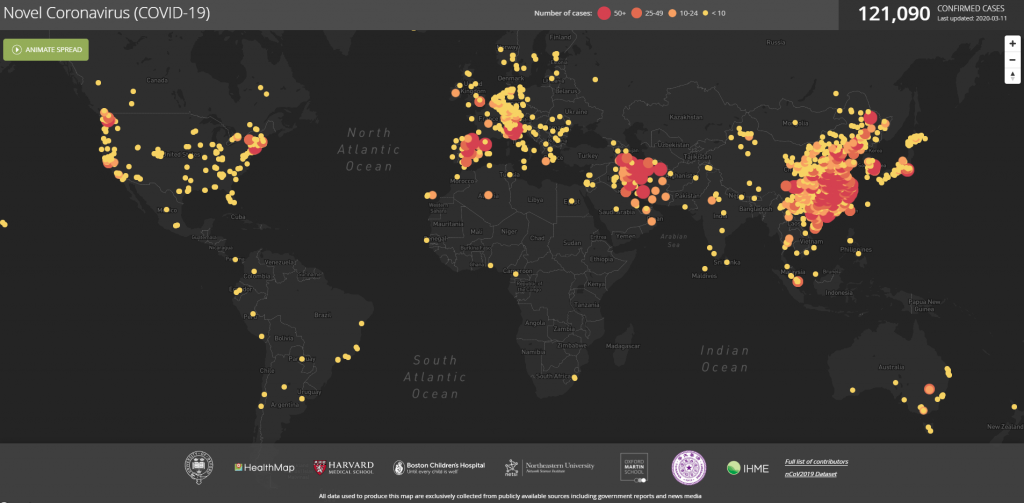
This map, put together by researchers from the University of Oxford, Harvard Medical School, Boston Children’s Hospital, and Northeastern University, displays the cases around the world. When animated, the map shows the spread of the virus from its point of origin in January through the latest numbers available.
Telling the story
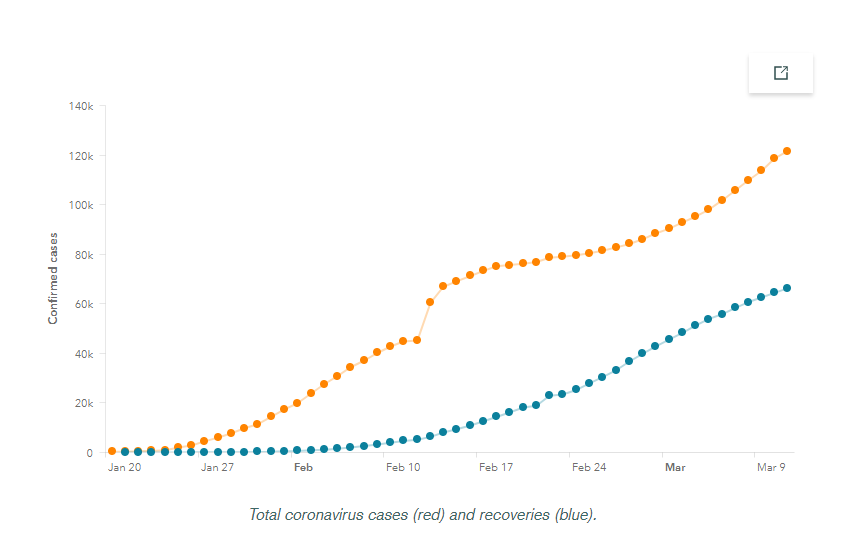
This StoryMaps visual offers digital storytelling rather than just a visual. It shows the spread of the virus in a different format, providing details on how the virus spread as well as a map of where it spread to, and when.
News sources
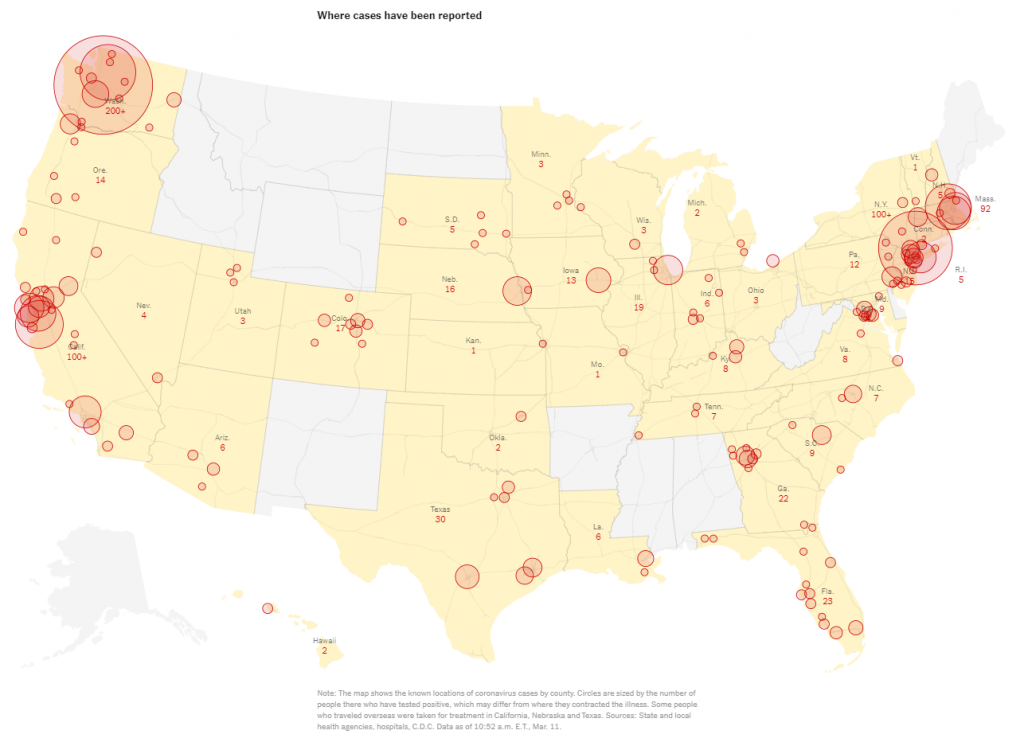
Different news sources have been constantly updating their infographics. This one, from the New York Times, breaks down the number of cases in the United States, showing which states have – and have not – had reported cases of the virus, and which parts of the country have been hit the hardest.
World Health Organization
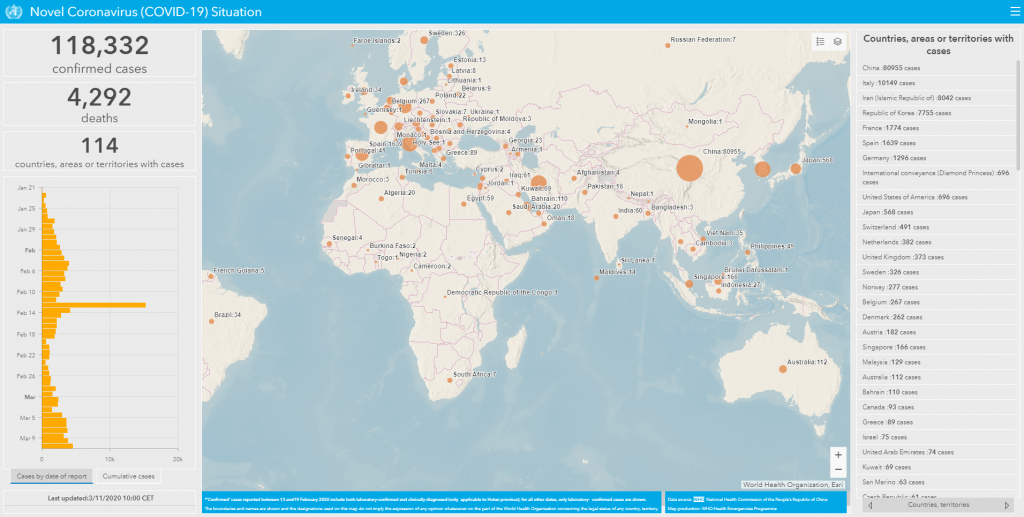
The World Health Organization (WHO), the source for much of the information being used by many of the other organizations mapping the virus, has its own visualization available on its website. This dashboard lists cases by country as well as on a map, and it also has a graph that displays the overall cases and the number of cases by the date they were reported.
Worldometer
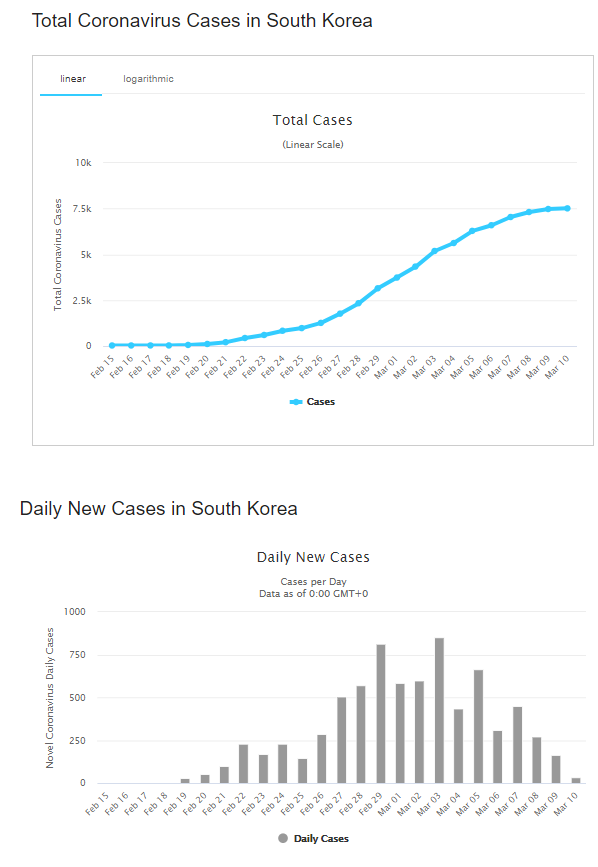
This website has useful info on the coronavirus outbreak, including incubation period and symptoms. It also has a country by country listing of total/new cases and deaths, and some graphs that show stats for each country. Here you can get a sense as to whether things are improving or getting worse in a particular country. For example, the graphs from South Korea show how the country has recently “bended the curve” in its total cases and is reporting fewer and fewer cases each day.
Conclusion
Data can be a powerful ally in the battle against the coronavirus. While most of these visualizations show what’s happening on a large scale, providers in communities can also use the data they have on hand to view trends and see what’s happening at a local level. What’s important is that people have access to data and can easily understand what it’s telling them so they can make better, more informed decisions as a result.
- Summer is an Opportunity for Digital Transformation in Education - April 17, 2024
- Your Car is Tracking More than Miles per Hour - April 11, 2024
- Data Can Help Provide Equal Footing in Cannabis Space - April 3, 2024


