To some people, analytics is an art form. To others, the data itself is art. Those people, including Grammy winner Jewel, bring data to life through...

Data-Driven Sculptures Can Teach Lessons about Analytics
read more
See how analytics trends are impacting your business and industry
To some people, analytics is an art form. To others, the data itself is art. Those people, including Grammy winner Jewel, bring data to life through...
Learn the key distinctions, pitfalls, and best practices for building trusted analytics environments. At Dimensional Insight, we’ve long subscribed...

The saying “one person’s trash is another person’s treasure” refers to those who find value in what other people may not. When it comes to waste...
The rainbow is a beautiful example of a terrible use of color. Well, that’s not entirely true. It’s wonderful to look at in nature. But it’s misused...

Supply chain data can mean many different things to different organizations. For some it can be used to make sure goods are being delivered in the...

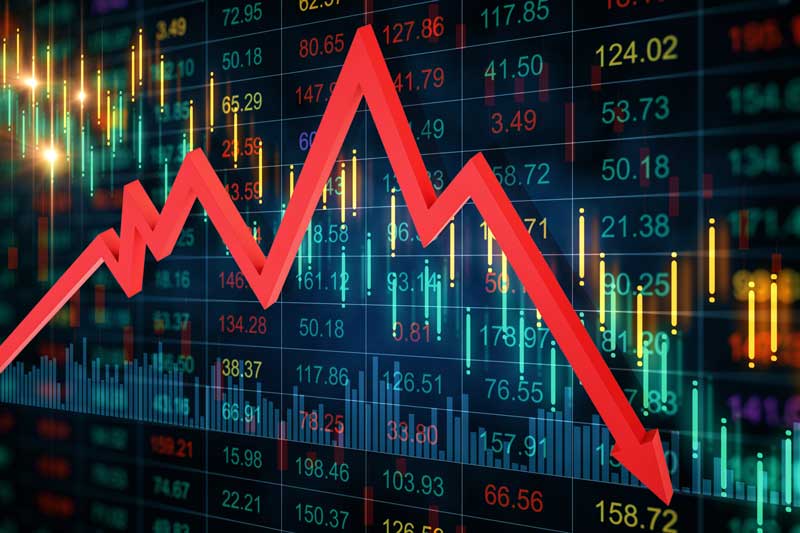
The beverage alcohol industry has reached a notable intersection. In the past, when one generation has reached a certain age and has seen a dip in...

Data informs many aspects of the world of higher education. The numbers are just half the battle, though. Often it is just as important to put the...

When you come across something challenging, how do you react? Let’s take math as an example. Many people believe their struggles in math are due to...
Dimensional Insight hosted yet another successful Dimensional Insight Users Conference (DIUC22) this past week in our nation’s capital. At this...
Just because it feels like something is true doesn’t necessarily mean it is so. That’s one of the benefits of analytics: the data can tell you...
With the worst days of the pandemic (knock on wood) behind us and lockdown orders lifted, the world has finally started to adjust to the “new...
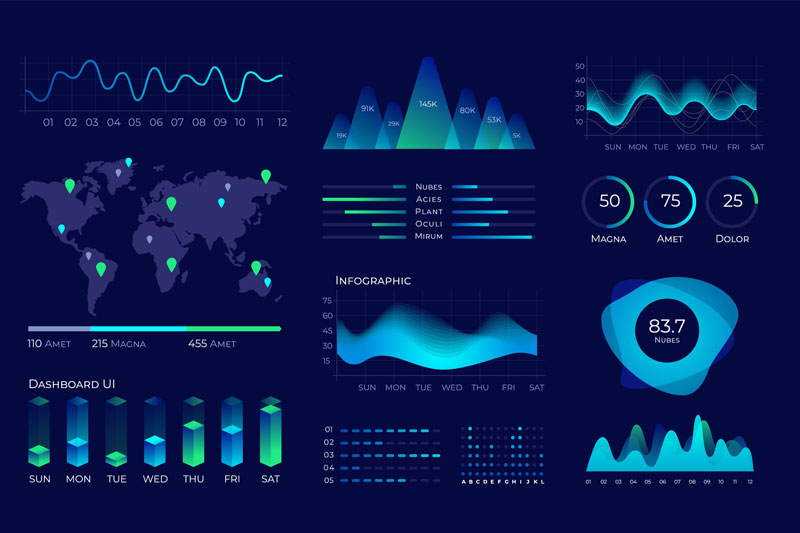
By definition, data visualization is about showing information in a visual format. People often get overwhelmed when they see numbers on a...
Do you need to compare periodic sales data across different regions or different products to inform and support your sales team? You have the data,...
Everyone knows the old adage, “A picture is worth 1,000 words.” How true this is, too, for data represented geographically! Maps provide an...