Seasonality analytics encompasses the occurrences of factors that are unique to a specific time, condition, or planning for an event that could occur like a natural disaster. In this article we asked three-Dimensional Insight experts from our beverage alcohol, healthcare and partner sectors to discuss the use of analytics to the plan and report on the effects of seasonality within their markets.
Nancy Berkowitz:
Manage inventory with seasonality analysis
Sales in goods and services and especially beverage alcohol are very holiday/season skewed. Typically, 60 % of wine and especially spirit sales take place during the holiday season. Sales escalation can also occur during holidays throughout the year such as Valentine’s day for champagne or Cinco de Mayo for tequila.
Typically, distributors and suppliers (wineries, distilleries, importers) of beverage alcohol will stock up prior to these time periods to support demand. Managing the inventory needed, last year’s sales and current trends help these companies determine what to purchase/sell and when.
Below are two examples of how companies analyze this information. The first is an inventory and goal management dashboard and the second is a dashboard allowing the user to compare any dates in time versus a prior period to understand what their future needs are bases on specific holiday bumps such as those that take place during Thanksgiving.
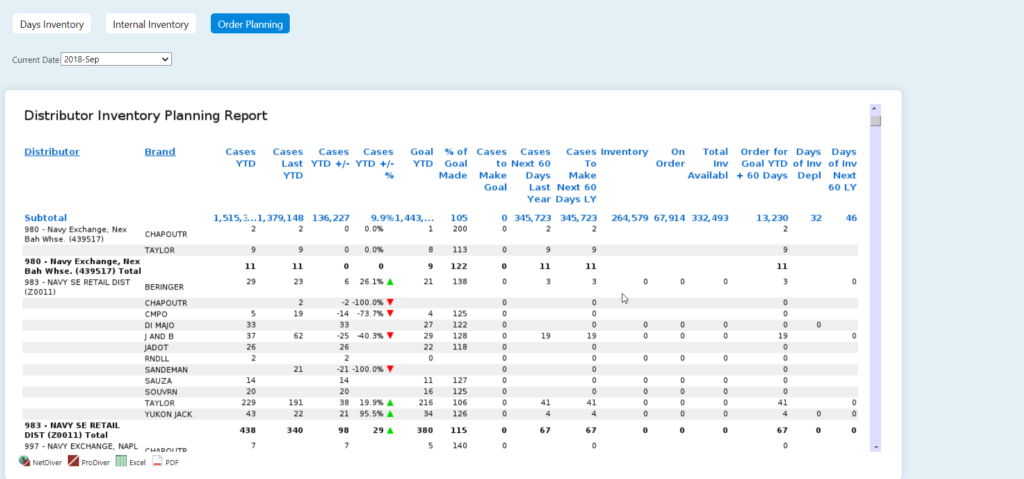
Inventory and goal management dashboard
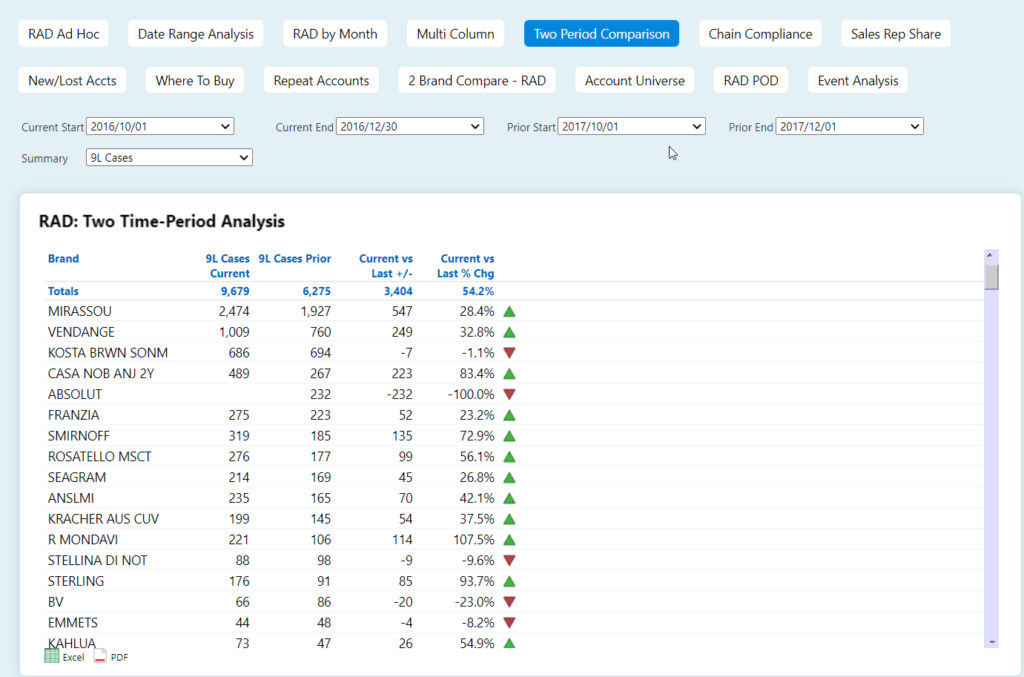
Two period comparison dashboard
George Dealey:
Optimize hospital staffing and resources with seasonality analysis
Among the many fascinating aspects of modern healthcare analytics is how massive volumes of information what’s come to be known as “big data” can illuminate patterns and signals that would otherwise go undetected. Those patterns can often provide insights into what is quite likely to happen in the future. In healthcare one example of this is the predictable nature of patient arrivals to a hospital’s emergency department.
Increased activity on Mondays and during full moons may seem like old wives’ tale, but it is well born out in the data. The months that are most prone to flu outbreaks, for example, are also likely to have higher demands on healthcare resources. Once an outbreak, or similar event, actually occurs, future predictions can be further refined using specific historical comparisons. Factoring in consistent day of the week and seasonal patterns can help to optimize hospital staffing to levels that provide high quality care while also keeping costs down. That same information can also be used to efficiently schedule other activities, such as elective surgeries, to balance availability of healthcare resources with forecasted demand. And as even more data become available and analytical techniques continue to improve, the precision and reliability of these predictions will continue to increase.
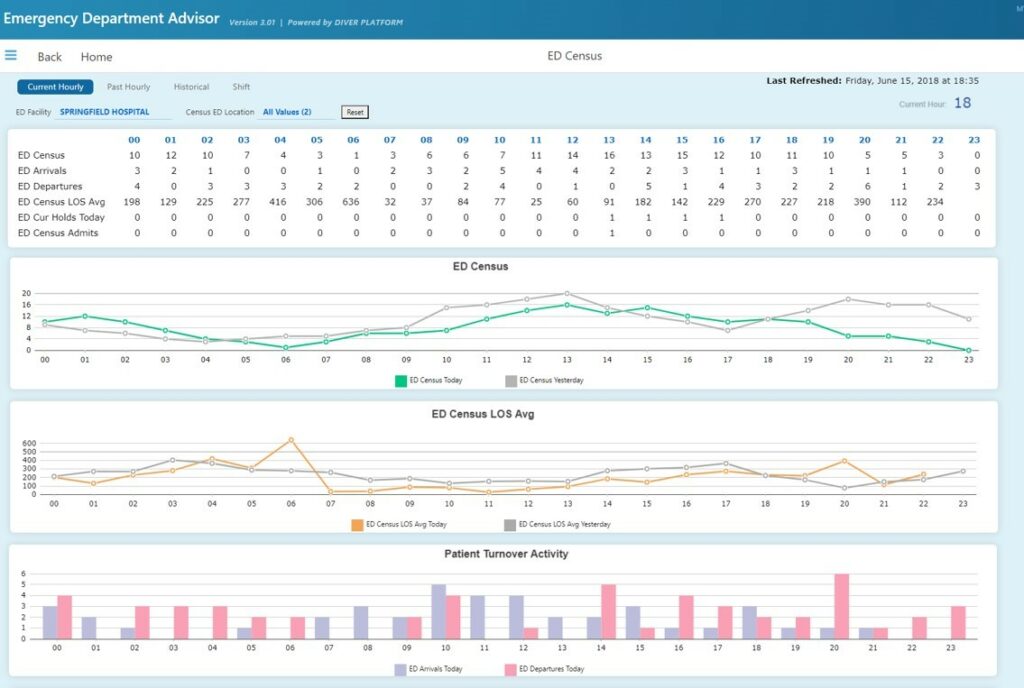
Emergency Department Census Dashboard
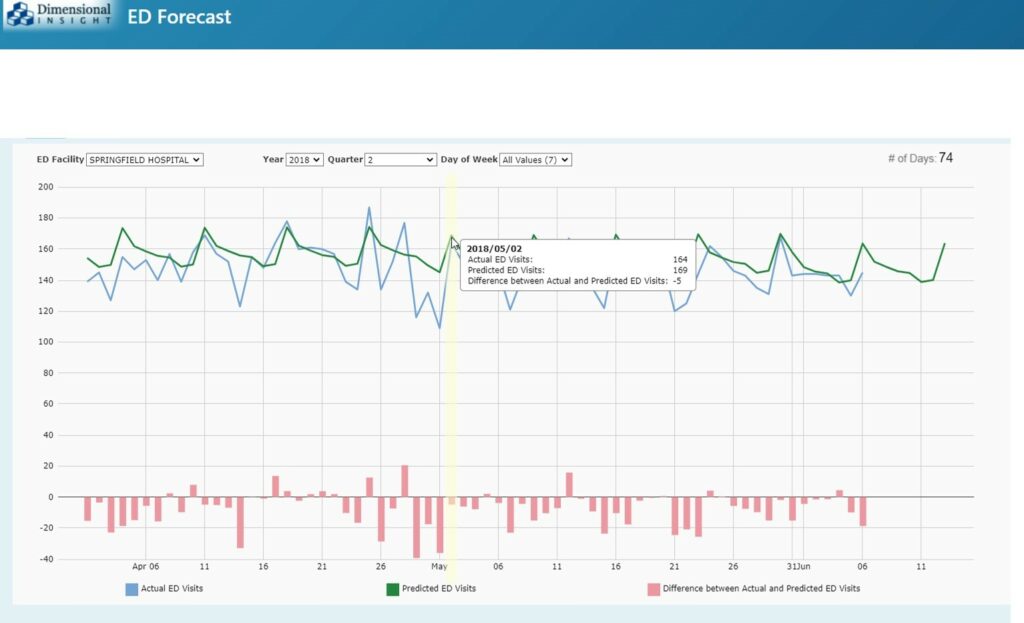
Emergency Department Forecast Dashboard
Lieven Schellevis:
Allocate budgets with seasonality analysis
In many organizations monthly budgets or forecasts are determined by simply dividing the annual budget evenly across the year. This doesn’t recognize the role of seasonal fluctuations that impact many industries.
Utlizing analytics like Diver Platform allows organizations to distribute budgets based on monthly, weekly or daily weightings. A very common method to apply seasonal logic into budget allocation, is to calculate the rolling average weighting of the last 3 years. In this way, the budget allocation will be updated automatically based on the seasonal trends of the last 3 years.
In the 2 the charts below, the total budget is the same, but in chart 1 the budget is evenly divided across all 12 months and in chart 2 the budget is divided over the 12 based based on historic seasonal patterns.

Chart 1
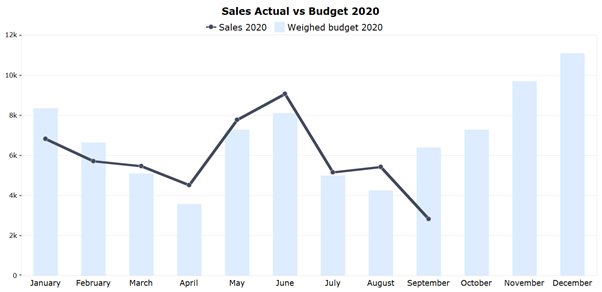
Chart 2

- The CBMTA is Here to Stay! Here’s Why That’s Good for Craft Brewers - January 6, 2021
- High-End Liquor Sales are Recovering Slowly - November 10, 2020
- How to Reach New Customers in 2021 - November 5, 2020