
What’s New on the Website
Press coverage
20 Skills Every Communications Professional Will Need By 2027

10.07.26
Press coverage
20 Outdated Corporate Terms To Retire Before 2027

Press coverage
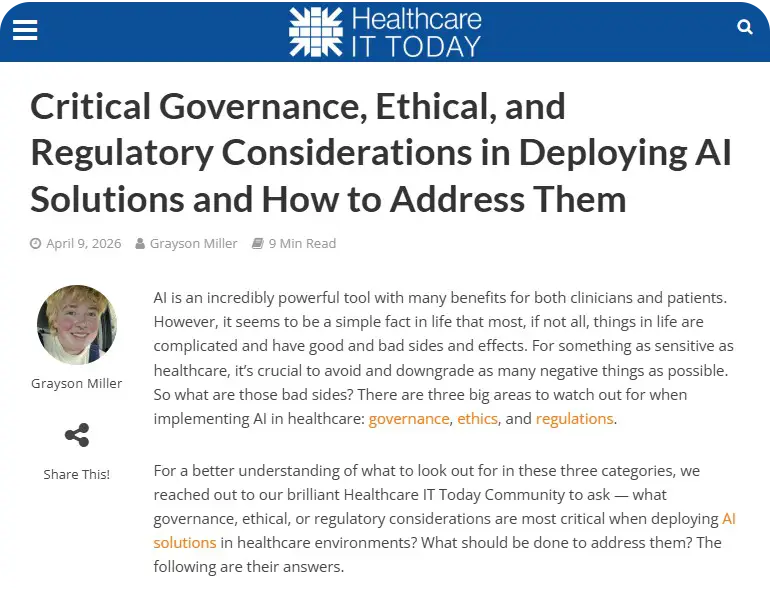
Critical Governance, Ethical, and Regulatory Considerations in Deploying AI Solutions and How to Address Them
04.01.26
Press coverage
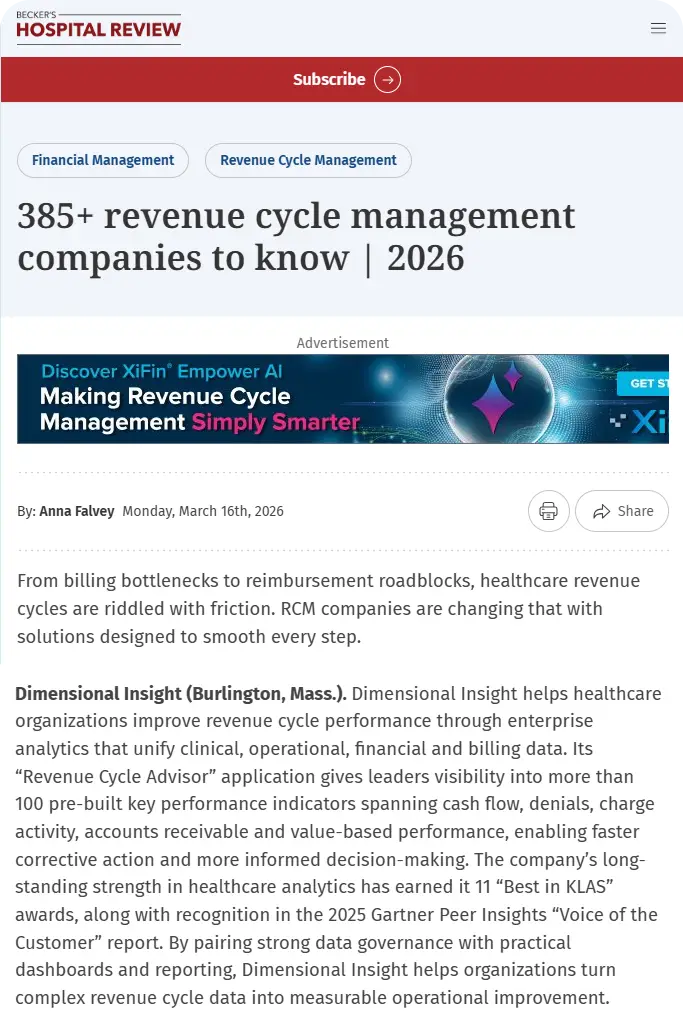
385+ revenue cycle management companies to know | 2026
03.31.26
Press coverage
AI Can Quickly Become a Confident Liar. Dimensional Insight Explains How to Prevent It.
Click to read the article
02.17.26
Press coverage
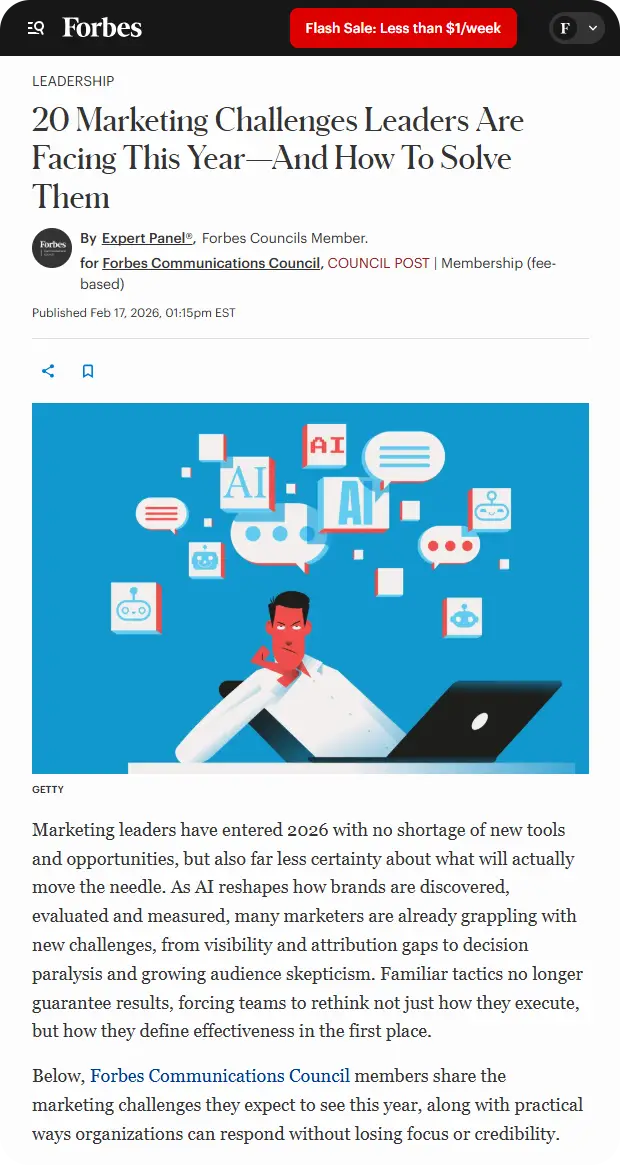
20 Marketing Challenges Leaders Are Facing This Year—And How To Solve Them
New Episode of the Knowledge Forum!
- DivePort: Controlling First-Load Behavior with Defaults
- Squashing vs. Diving: Comparing Spectre Flow and Spectre Dive
Watch new episode →
New Episode of the Knowledge Forum!
- DivePort Page Types
- Crosstab: Brand Analysis in NAVO
Watch new episode →
Press release
Dimensional Insight named a Strong Performer in the 2025 Voice of the Customer for Analytics and BI
Distinction in Gartner Report Is Based on Feedback and Ratings from End-User Professionals
Press release
Dimensional Insight Recognized in KLAS 2025 Consistent High Performers Report
Recognition underscores Dimensional Insight’s long-term commitment to trusted partnerships, measurable outcomes, and customer satisfaction in healthcare analytics
12.05.24
New Episode of the Knowledge Forum!
- Using Program Advisor
Watch new episode →
12.01.25
Press coverage
Leveraging Advanced Analytics and AI Tools to Derive Actionable Insights from Complex Healthcare Datasets
News Archive
2025
2024
2023
2022
2021
2020

Proper Data Governance Prevents Data Slop
While much of the talk around AI is about its potential, everyone who uses it probably has an example of its limitations. “AI slop” is common. There are images with too many fingers, the tell-tale grammar error, or the out-and-out misrepresentation of facts.
It could just as easily be called “data slop.” Artificial intelligence is only as good as the data that is powering it. Slop is the result of data being continuously fed into a system with no plan, and it is why governance is so important for organizations working with data. There is so much a business intelligence solution can do, but none of the technology can work effectively if the data that is fed into it isn’t accurate. Here’s how you can make sure you are using clean data, and how that can help your organization use data successfully.

Tracking Shipping Price Changes with Analytics
When you run a business, there are decisions to make every day. For organizations in the supply chain industry, it seems like those decisions never stop. Price fluctuations along different parts of the supply chain mean decision-makers are constantly assessing how to make sure the business can run efficiently.
Transportation companies are trying to make their own decisions that are good for them. Let’s take a look at some of the changes supply chain organizations have to consider when shipping goods, and how analytics can help make sense of it all.