Data can sometimes be intangible. We don’t encounter the numbers in our everyday lives that organizations spend most of their time trying to make sense of in order to better their business. Sometimes, though, data is very much tangible, and people encounter it all the time, but might not think about it because it doesn’t apply to them. That’s the case with accessibility.
The Americans With Disabilities Act Standards for Accessible Design lay out the requirements for businesses’ accessibility. So much of that is data that has a great impact on the lives of millions of people—16% of the global population, according to the World Health Organization. Here’s a look at some of the ways that information gets to the people who need it, and how that can offer a road map for how analytics can work for your organization.
Accessibility data
Wheel the World is a web-based travel agency offering travel packages that can include accessible transportation and equipment such as amphibious wheelchairs and adaptive kayaks. It rates properties based on standards created through interviews with members of the disability community. It also has more than 200 data points per hotel that creates a database of the information that matters to travelers with disabilities, such as bed heights, door widths, and bathroom accessibility.
Google Maps is expanding its accessibility offerings to become more inclusive. It allows for you to search wheelchair accessible transit under ‘Routes’ when you search for transit directions, and is working towards comprehensive surface routes that are stair-free. Similar to Wheel the World, Roll Mobility is an app that crowdsources data. It provides the kinds of information that can affect how someone in a wheelchair might enjoy a night out at a restaurant, for example. The app can inform users about table and bar heights, and whether a floor is carpeted or paths to the bathroom are wide enough.
Getting information when you need it
Be My Eyes is an app that works to provide information to the visually impaired in real time. More than 10 million volunteers speaking almost 200 languages help blind or low vision users who want assistance. The users can get a volunteer to describe what’s in front of them by showing video on their phone, or they can get a description of a picture using artificial intelligence.
This can be especially helpful when someone who is blind or has limited vision is in an unfamiliar place. They can also use apps like AVIV ScoutRoute to help them navigate unfamiliar streets. The app, which helps people with limited mobility as well, can provide information about sidewalk depth and composition.
What kind of data is meaningful for your audience?
All data means different things depending on who is looking at it. The customer, the shipping company, and the retailer can all receive the same information about a package, but all three entities can be using that information in different ways. That’s what makes a comprehensive analytics solution so important. It can help organizations figure out which points, out of vast amounts of data, are worth focusing on and figuring out how to use in order to help the organization.
All of the apps and websites mentioned above serve as good examples of how the proper approach to data can provide important results:
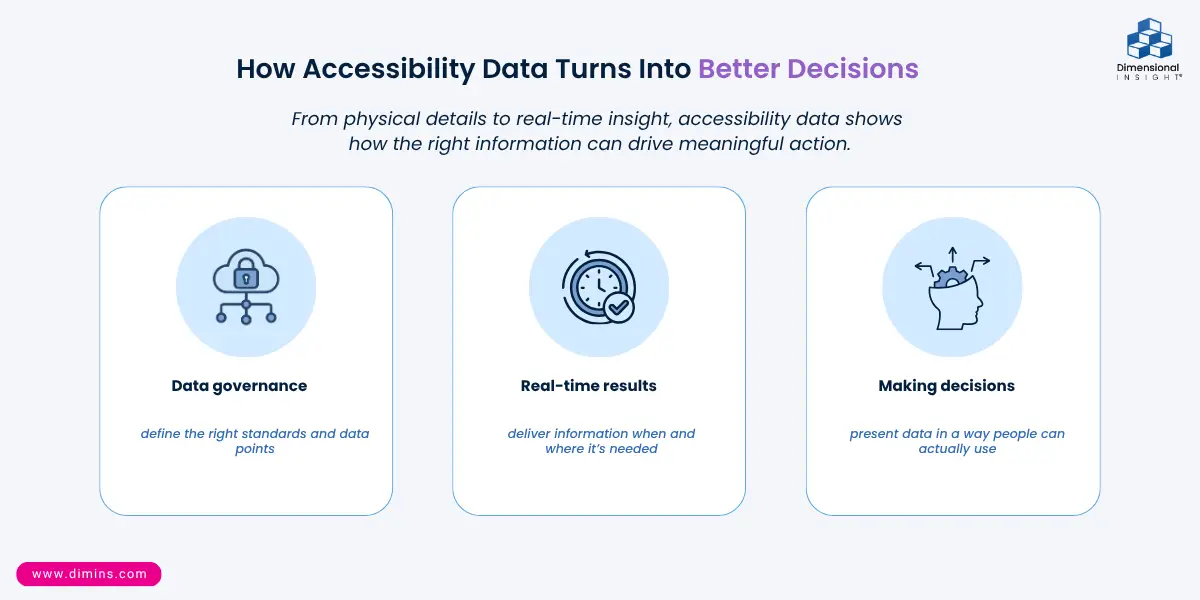
- Data governance: Wheel the World offers a good model for how organizations can begin their process. By figuring out its standards through interviews with members of the disability community, it zeroed in on what was important and what it was measuring against. It is important that everyone in your organization is working from the same data, and by interviewing various stakeholders you can get a sense of which data points will matter the most.
- Real-time results: An app like Be My Eyes gets people information when they need it. The right analytics solution can provide the necessary information to anyone, anywhere. It needs to be able to work with a variety of sources to gather data and then to bring it together to produce comprehensive reports.
- Making decisions: Analytics is all about using data to make better decisions. When it comes to accessibility, the data is being used to figure out where someone can go without facing obstacles. In the business world the data can help decision-makers, but only if the information can be presented in a way that makes sense. That’s where an analytics solution comes in.
While not everyone may be thinking about the height of a curb or the width of a restaurant’s pathway to the bathroom, the data behind accessibility is being gathered everywhere. The same is happening in organizations around the world, as they gather all kinds of information that can help them make better decisions. That work depends on an analytics solution that can help them make sense of the data that customers may not even be aware exists.

- Data-Driven Sculptures Can Teach Lessons about Analytics - July 7, 2026
- Using Data to Improve Perceptions of Higher Education - June 25, 2026
- What AI on the Farm Teaches Us About Data-Driven Decision Making - June 18, 2026