We humans like pictures. We’re wired to process images quickly and effectively.
The evolution of those capabilities over thousands of years has allowed us to survive by detecting and evading predators, finding forage, and excelling as predators ourselves. To support these activities and others, the image processing capabilities of our brains have become especially adept at distinguishing basic shapes, such as lines, circles and various polygons, as a precursor to fully comprehending what the actual imagery represents.
We are also capable of understanding complex concepts, abstractions and relationships. But not all of us are created equal in that respect – at least judging from the distribution of scores on the math component of college prep exams! But even the savants among us reach a limit as the volume of data and complexity of problems become intractable to the human mind.
And though we may differ in our analytical abilities, we do seem to share one thing: our ability to reason visually plays an important role in our problem solving. Let’s examine this in the latest “Practical Analysis” blog post.
Is visualization only for analytical lightweights?
Using simple pictures to solve complex problems may seem a bit counterintuitive – maybe even a cop out. However, it comes with some undeniable credibility.
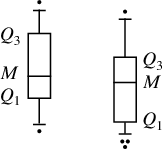
As I noted in my earlier posts on Exploratory Data Analysis, John Tukey, the brilliant mathematician and statistician, did a lot to legitimize the use of visualization to aid in the understanding of patterns and relationships in large sets of data. His “boxplot” chart, for example provides a concise, visually intuitive way to highlight the central tendency, distribution and presence of outliers in a data set—important initial steps in understanding the data well enough to apply the appropriate analytical techniques.
That’s not to say that there aren’t controversies over how and when to apply visualization. For instance, there’s an ongoing debate around whether it should emulate art—employing “creative flair”—or be kept as simple as possible while emphasizing the patterns in the data. There’s really no right or wrong here, but the main considerations should be efficiency and accessibility: the simplest ways to communicate the most information in a manner that can be understood by as many people as possible.
Contributions to the visualization body of knowledge
Edward Tufte, a colleague of Tukey’s, addressed these questions in his book, The Visual Display of Quantitative Information, which has become a classic in the realm of data analysis. Tufte compares the field of graphical design to mathematics in that it is built on a set of universal principles that transcend language and culture. Certain things “just work.”
In addition to providing a rich set of examples that reinforce his proposals of what is visually effective, Tufte dispenses some basic, but ultimately helpful advice:
- Show – and emphasize – the data
- Induce the viewer to thinking about the substance of the information as opposed to the design of the graphic
- Avoid distorting what the data has to say
- Make large data sets coherent
- Encourage the eye to compare different pieces of data
- Reveal data at several levels of detail, from a summarized view, to fine structure
- Serve a reasonable and clear purpose: description, exploration, tabulation – or decoration if that’s the objective
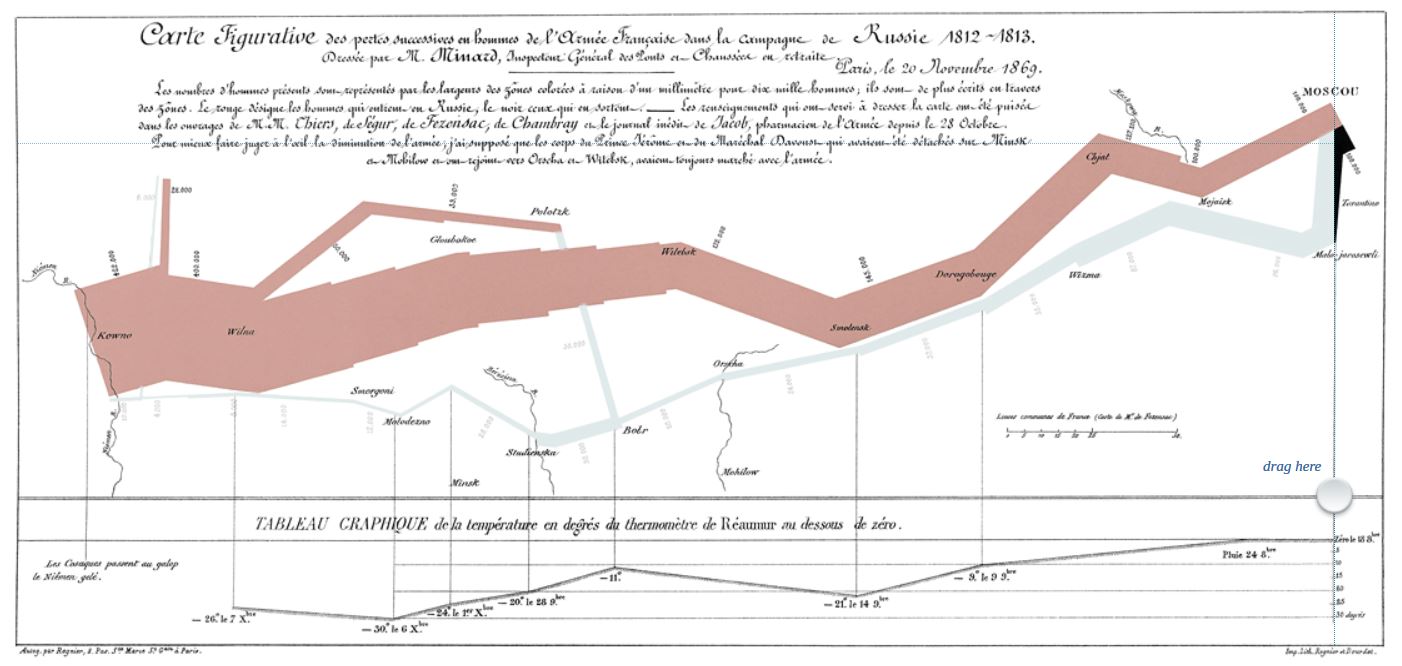
One classic example of packing lots of information into a visual representation, while still preserving its meaning, is Charles Joseph Minard’s imaginative chart which shows the advance, and then retreat, of Napoleon’s army during the Russia campaign of 1812 to 1813. It’s a great example of what’s possible with creativity and discipline.
But often less is better when it comes to aiding comprehension. Tufte demonstrates this throughout the book with examples that improve on “overdone” representations by eliminating “non-data ink” until the visualization is distilled down to its essence.
Granted, lots has changed since Tukey’s and Tufte’s initial work. Tukey’s books included hand-drawn charts, and many of Tufte’s examples seem crude compared to what’s possible with today’s software tools. But their fundamental principles have been advanced by the next generation of thinkers. Among the most prominent examples are Stephen Few and Colin Ware.
Advancing the work of Tukey and Tufte
Steven Few took the next step of applying Tufte’s concepts to computerized displays, such as dashboards. In his book Show Me the Numbers, he provides simple and practical guidance on how to present data from a variety of perspectives that enhance understanding. He emphasizes techniques that have proven practical across the fields of science, business, and technology. His most important contribution in my view has been promoting a basic and universal level of numerical competency that would equip more people with the skills to make objective, data-driven decisions.
Colin Ware’s book Information Visualization: Perception for Design provides a comprehensive and quite technical treatment of the theory, mechanics, and practice of visualization. If you really want to understand the most effective use of color, how to create contrast, and strike a balance between complexity and clarity, this work is for you. It delves deep into the theory behind why certain visualization techniques work better than others. Stephen Few refers to this as the “bible” of visualization and draws from it often in his work, translating the theory into practical advice.
The bottom line & key takeaways
So to boil down the discussion around visualization that’s permeated my last few posts, here are some specific suggestions:
- Whether you are a hardcore analyst or merely someone trying to harness the power of information to make better decisions, visual proficiency should be an important part of your analytical toolkit.
- That goes for interpreting someone else’s visualizations as well as creating your own. You’ll invariably discover that communicating through pictures is an effective way to make your points and tell your own story.
- Finally, don’t fall into the trap of reinventing the wheel. Lots of smart people have been working to perfect ways to communicate visually since ancient times. Take advantage of what’s proven to be both effective – and simple.
In the next post we’ll explore the fundamental techniques that work best when it comes to communicating data – among humans, that is!
Related reading
- How Exploratory Data Analysis Helps You Generate Meaningful Insights
- Practical Analysis: The Foundation of Analytics Knowledge
- Practical Analysis: The Next Chapter - May 21, 2020
- Exploratory Data Analysis Part 2: Helping You Make Better Decisions - October 11, 2019
- Practical Analysis: Understanding Visualization Concepts - September 19, 2019


