What’s New on the Website
04.25.24
What’s new in Diver Platform Help
We have released an online help website for installation guides and updating procedures as well as guides for DI products such as:
- DI-Scheduler
- DI-Broadcast
- DI-Updater
- Bridge
- Licensing
Links to the various versions of the help can be found in the Software Installation section of DI Documentation.
04.19.23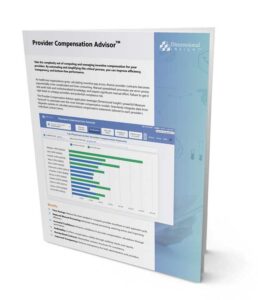
White paper
Provider Compensation Advisor™
As healthcare organizations grow, calculating incentive pay across diverse provider contracts becomes exponentially more complicated and time-consuming. Manual spreadsheet processes are error-prone, lack audit trails and institutionalized knowledge, and require significant manual effort. Failure to get it right leads to unhappy providers and potential compliance risk.
The Provider Compensation Advisor application leverages Dimensional Insight’s powerful Measure Factory® to automate even the most intricate compensation models. Seamlessly integrate data from disparate systems to calculate personalized compensation statements tailored to each provider’s individual contract terms.
04.19.24![]()
New Episode of the Knowledge Forum!
- Creating Custom Dashboards in Distributor Advisor
- Getting More Out of JSON Data: Sub-Arrays and Sub-Objects
- Internal Factory Rule
04.12.24
What’s new in Diver Platform Help
Available in DivePort, use the find feature to filter the rows you want to view in your measures portlet using information based on the data type: date, numeric, or string.
03.28.24
What’s new in Diver Platform Help
New in 7.2 Workbench, users can open .txt and .csv files as a cBase in ProDiver simply by right-clicking on them in Workbench and selecting “Open in ProDiver” from the context menu. The file is automatically built as a cBase and that cBase opens in ProDiver.
03.28.24
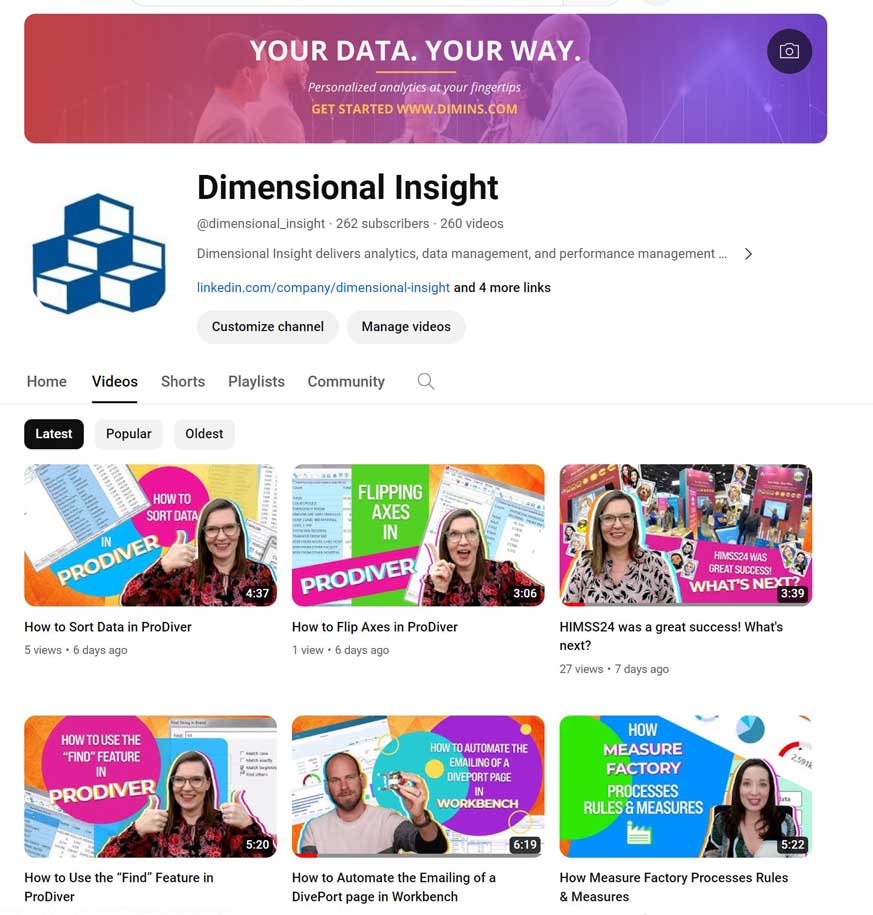
You asked, we delivered.
We’ve been hard at work over the last few months in posting our educational videos up on YouTube. Head on over and see what we’ve been up to!
We don’t have our whole library up yet, but we’re getting there. Go check out our channel for yourself, and while you’re there, please subscribe to our YouTube page. That way, you’ll get notified of new videos as they’re released.
Happy video watching!
03.15.24
What’s new in Diver Platform Help
Starting in DivePort 7.2, you can set up a QuickView to display each value as a separate button. A QuickView set up this way is called a button QuickView.
03.14.24
Check out the Two New Videos on Our YouTube Channel!
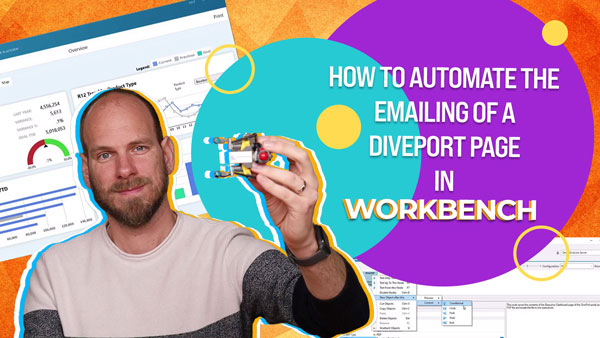
How to Automate the Emailing of a DivPort page in Workbench →
03.14.24
Press coverage
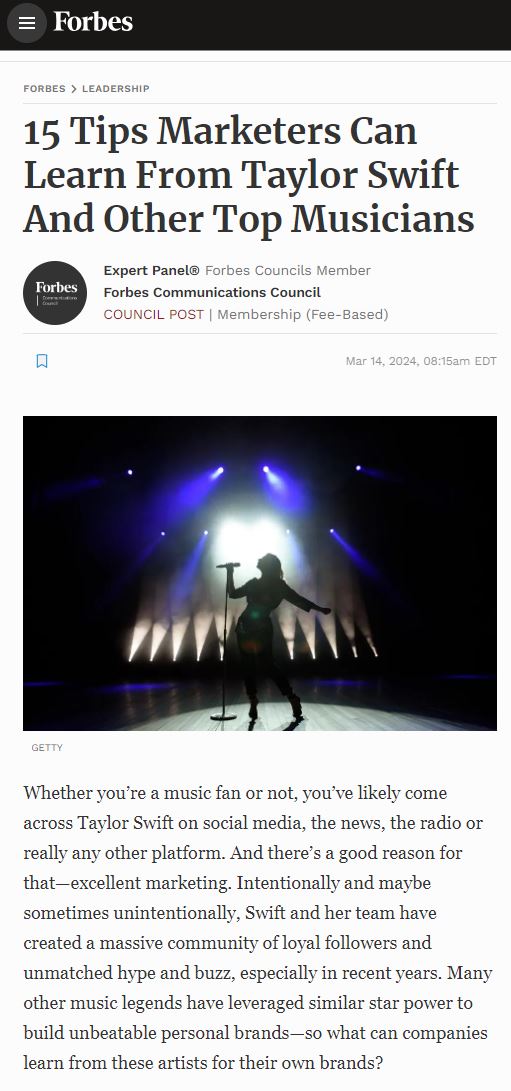
15 Tips Marketers Can Learn From Taylor Swift And Other Top Musicians
03.05.24
Press coverage
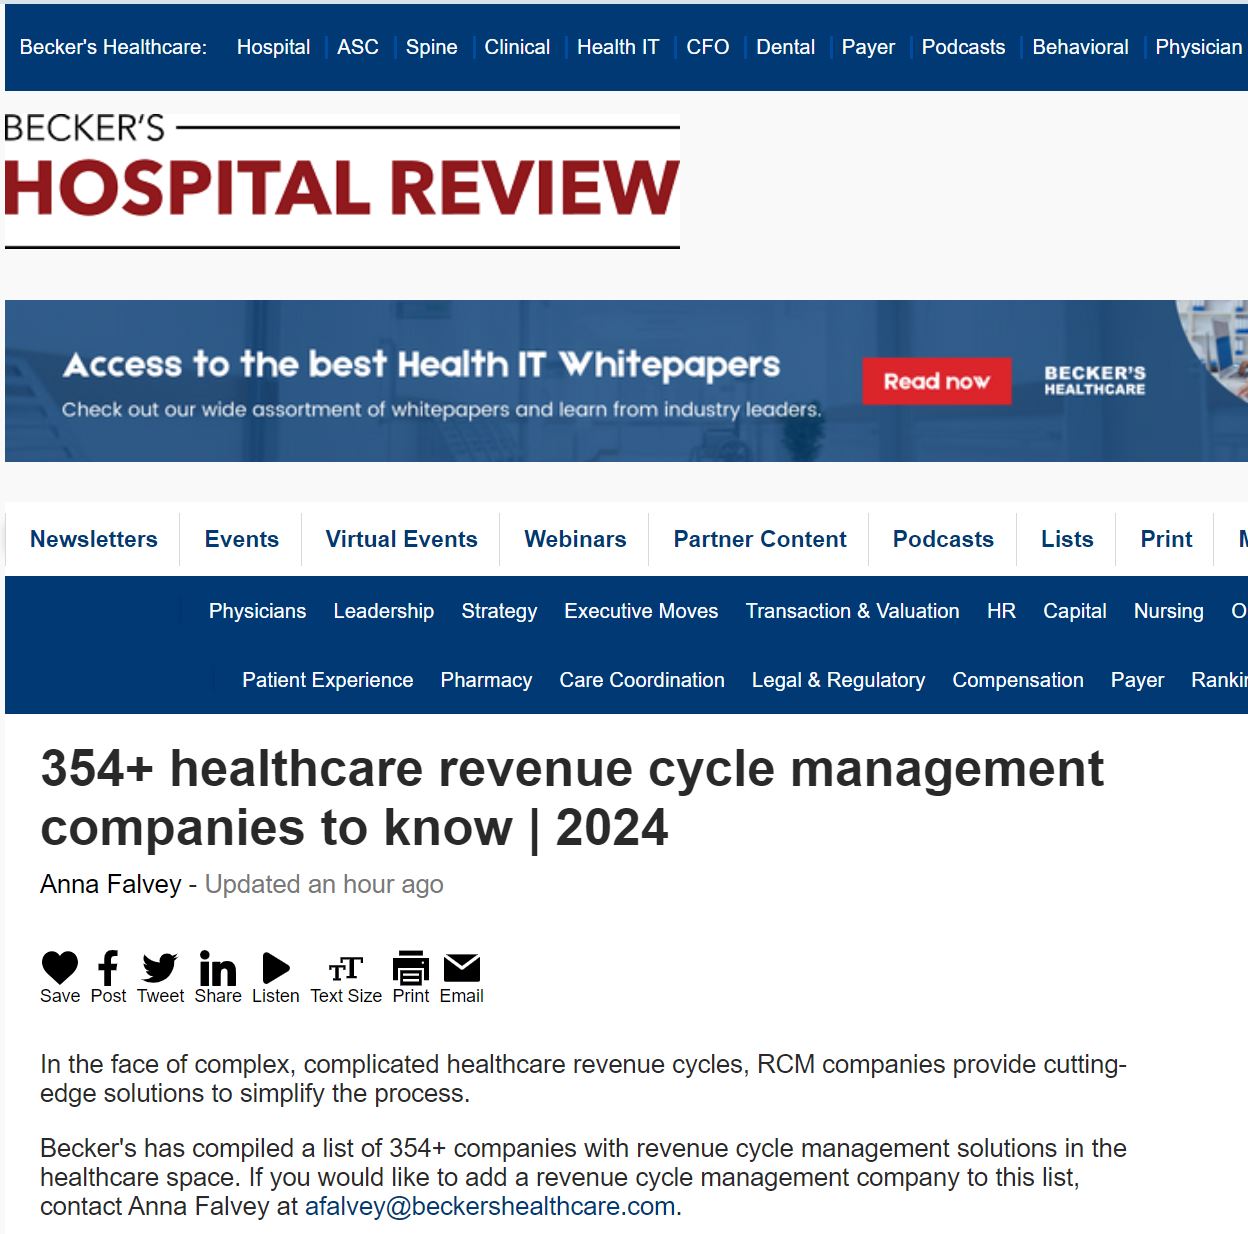
354+ healthcare revenue cycle management companies to know | 2024
02.29.24
What’s new in Diver Platform Help
Available now in Workbench and DiveLine 7.2, user access tokens allows users to access DiveLine features with a revocable token instead of a password.
New Episode of the Knowledge Forum!
- CrossLinks, Pop-up CrossLinks and Built-in Macros in DivePort
- Controlling Selected QuickViews and Measures
- Custom DivePort Macros
02.08.24
Press coverage
Best in KLAS 2024 shows vendors being more proactive for their clients
Dimensional Insight Ranked #1 Data & Analytics Platform for 10th Year by KLAS Research
Setting the standard for excellence in healthcare analytics, Dimensional Insight achieves top spot for data & analytics yet again in 2024 Best in KLAS: Software & Services Report.
02.05.23![]()
Join Women of the Vine & Spirits for a Live Chat
Pivoting in Parenthood
Thursday, February 15 | 10:00AM PST/1:00PM EST
Hosted by the WOTVS Working Parents Business Resource Group
Parenthood involves significant changes and adjustments no matter what stage you are in, especially when combined with managing a career. Join our Working Parents BRG Live Chat as the group discusses the major transitions/pivotal moments, the challenges that come with each stage in childhood, and what has helped them stay flexible throughout this journey.
Key Takeaways:
- Preparing for parental leave.
- “The Fifth Trimester”: navigating the challenges of returning from parental leave.
- Transitions during key timeframes such as summer break, holiday break, or a new job.
- Resources to help you navigate through transitions
Including our VP of Marketing Kathy Sucich as one of the panelists.

Who Should Attend:
All Members Welcome.
02.02.23
White paper
5 Data Trends for 2024
In many ways, 2023 was the year of Artificial intelligence (AI). It seemed like you couldn’t talk about technology in any way without AI being brought into the conversation. Early indications are that 2024 will not be all that different when it comes to the topic of AI.
While AI won’t be the only tech trend in 2024, a lot of what happens in the new year will revolve around artificial intelligence in some way. Here’s a look at some of those technology trends, and how AI will have an impact on them:
- Artificial intelligence
- Increased threats
- Sustainability efforts
- Customer experience
- Omnichannel retail
01.31.24
Webinar
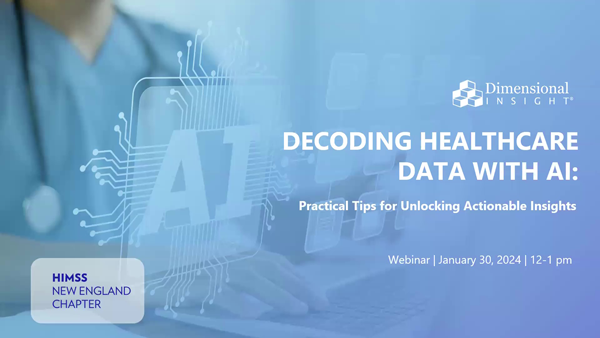
Decoding Healthcare Data with AI:
Practical Tips for Unlocking Actionable Insights
AI and machine learning offer immense potential for unlocking insights from healthcare data. While generative AI has garnered all the buzz in the headlines, quantitative AI works behind the scenes on many of healthcare’s real-world data challenges.
In this webinar, we’ll explore the automation power of analytics models and algorithms to tackle high-impact healthcare use cases. You’ll learn how AI can help to forecast patient volumes, predict wait times, optimize staffing, and more.
You’ll walk away empowered to assess data readiness at your organization and become a “citizen data scientist.”
Join us and discover practical approaches to data-driven AI that can help advance actionable change at your healthcare organization.
Learning Objectives
- Understand the fundamental capabilities of machine learning/AI tools & technologies
- Differentiate between generative and quantitative AI techniques
- Identify the approaches that are most appropriate for specific healthcare use cases
- Learn how to apply AI and machine learning tools to practical healthcare scenarios
- Demonstrate how “Citizen Data Scientists and Data Analysts” can take advantage of AI in healthcare settings
include visualizations of the target pages rather than the typical buttons.
01.22.24
Press coverage
14 Tips New Professionals Should Know About How To Succeed In Comms
![]()
01.11.2024
Press coverage
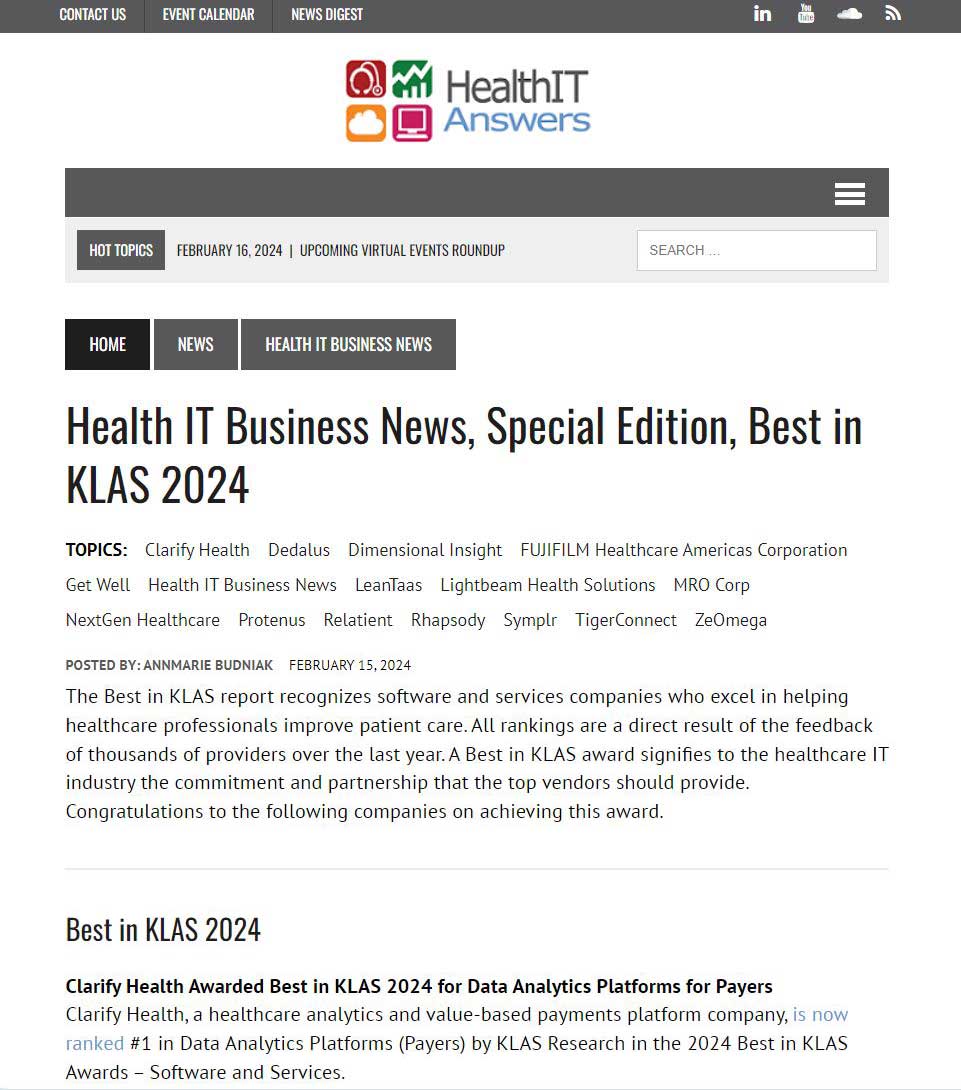
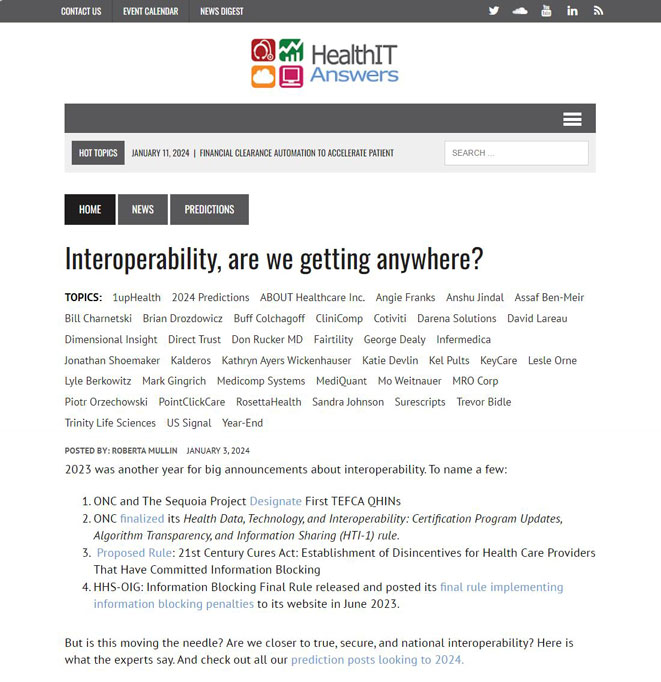
Interoperability, are we getting anywhere?
George Dealy’s quote has been included in Health IT Answer’s latest article.
01.11.23
Data sheet
Introducing new Measure Factory data sheet
Intuitive, automated & trustworthy business rules management at your fingertips.
01.05.23
DIUC23 videos have moved to the archives
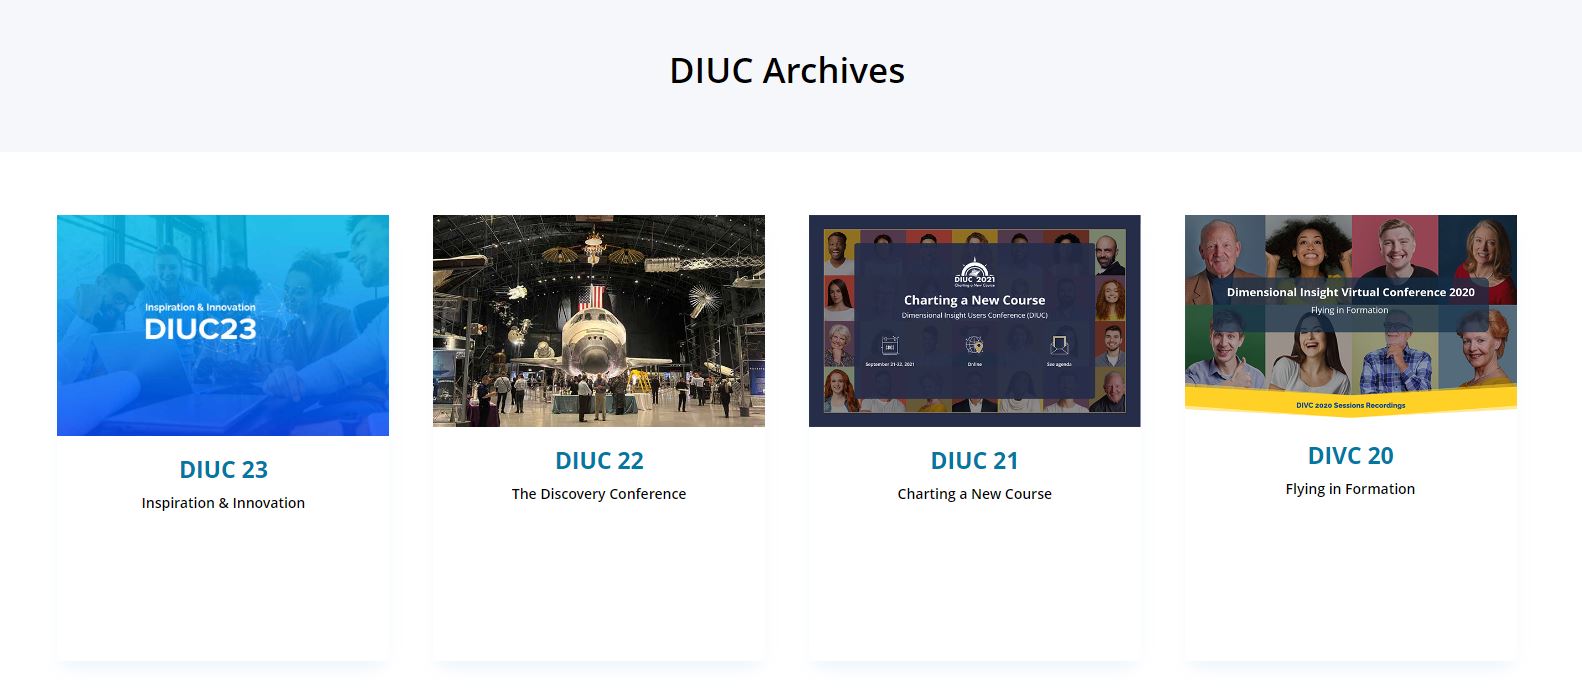
To navigate to the archived DIUC content go to Resources > DIUC Archives.
To access DIUC23 content, please follow the link below.
01.04.23
What’s new in Diver Platform Help
Available now in Workbench and DiveLine 7.2, the ODBC Registry allows multiple ODBC connections on one DiveLine server.
01.02.24
Webinar
Decoding Healthcare Data with AI: Practical Tips for Unlocking Actionable Insights
NE HIMSS Premier Sponsor Webinar presented by Dimensional Insight
January 30, 2024 | 12 pm | Online webinar
AI and machine learning offer immense potential for unlocking insights from healthcare data. While generative AI has garnered all the buzz in the headlines, quantitative AI works behind the scenes on many of healthcare’s real-world data challenges.
In this webinar, we’ll explore the automation power of analytics models and algorithms to tackle high-impact healthcare use cases. You’ll learn how AI can help to forecast patient volumes, predict wait times, optimize staffing, and more.
You’ll walk away empowered to assess data readiness at your organization and become a “citizen data scientist.”
Join us and discover practical approaches to data-driven AI that can help advance actionable change at your healthcare organization.
Learning Objectives
- Understand the fundamental capabilities of machine learning/AI tools & technologies.
- Differentiate between generative and quantitative AI techniques.
- Identify the approaches that are most appropriate for specific healthcare use cases.
- Learn how to apply AI and machine learning tools to practical healthcare scenarios.
- Demonstrate how “Citizen Data Scientists and Data Analysts” can take advantage of AI in healthcare settings.
News Archive
2023
2022
2021
2020

Navigating the Wellness Wave: Wine & Spirits Data Strategy
The pursuit of health and wellness is reshaping consumer preferences, including in the wine and spirits sector. Recent stats highlight a significant movement: nearly half of all U.S. adults participating in a study expressed a desire to moderate their alcohol consumption, driven not just by health and wellness considerations but also by economic concerns. This inclination towards moderation is coupled with a rising interest in “better-for-you” alcohol products, a category that has seen a 20% increase in consumption within a year.

Data Can Help Provide Equal Footing in Cannabis Space
Data can be the difference between one cannabis company finding success and another one struggling. The industry is still emerging, even in states where it has been long-established, and any advantage that a company can get can help set it apart. The major problem when it comes to data, though, is how expensive it can be to obtain.
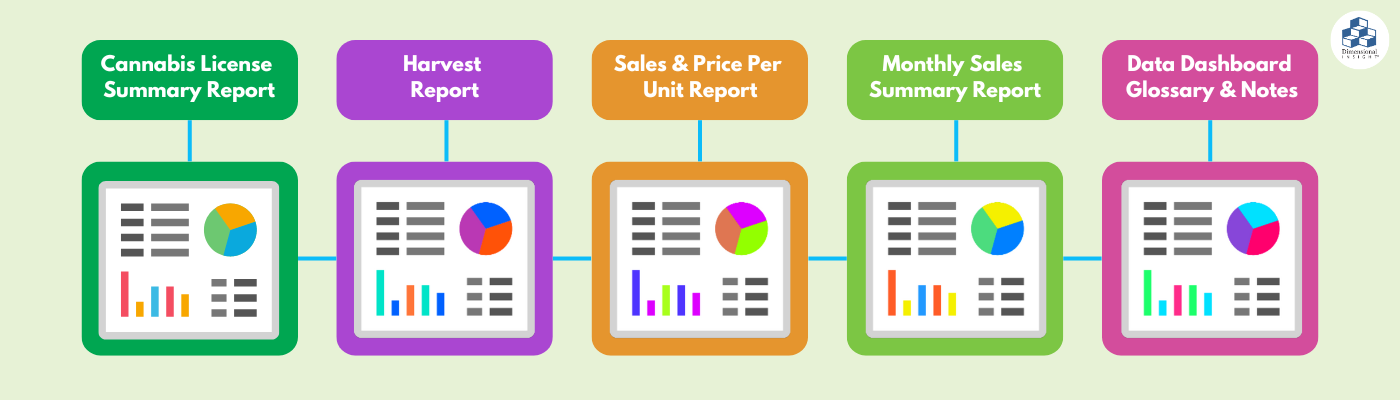
The state of California is one of those markets where recreational use cannabis has been legal for years, but the industry is continually evolving. California recently evened the playing field a little bit when it comes to data. In February, California’s Department of Cannabis Control (DCC) made public four data dashboards to display essential licensing, harvest, and sales statistics for the state’s cannabis industry. As it says on the DCC’s website, “These dashboards transform raw data from DCC’s licensing and track-and-trace systems into valuable insights to inform consumers, cannabis businesses, policymakers, local government officials, and researchers.”
Vital information
The dashboards use numbers from the past few years, and are made up of statistics including data compiled from licensed cannabis businesses in California all the way through information about the supply chain.
Among the numbers the dashboards provide access to are the price per unit of all types of cannabis products, including flowers, vape cartridges, edibles, extracts and other concentrates, and monthly sales for all product categories. The harvest report can be searched by county, license category, and facility type, and it can be broken down by month, quarter, or year. The report provides a glossary page that defines terms, and includes information like plant counts, waste weight, and data about moisture.
The cannabis product data dates back to January 2020, and the DCC expects that data to update quarterly. They will update the information on licensees and licensed businesses weekly.
What the data can mean
For existing business owners, access to this type of data could inform whether there is an opportunity to expand, and for those looking to break in to the industry, it can offer a look into what that they might be able to expect. It offers transparency into the overall health of the cannabis industry in California. The dashboards use information that retailers enter into the track-and-trace system to provide statewide sales summaries, allowing for a comparison of, for example, total sales from adult-use customers at licensed dispensaries versus total sales from medical cannabis patients.
For an industry that is so regulation-driven, the transparency into the product is important. It allows a company to know exactly where its plants are coming from and how they were grown. For the DCC itself, “We’re using a lot of this information to drive policy development, and inform policy development, to better understand the cannabis industry in California and how our licensees are operating, so that we can develop better policies and federal regulations. “So internally, there’s tons of value for this data, but also externally, the public dashboards are really aimed at benefiting our licensees. We’ve heard a lot from our licensees about more access to data.”
Organizations in other states might find some value from the California databases. If nothing else, they could use it as a starting point to figure out what they want for themselves. One important feature of the right analytics solution in the cannabis space is flexibility. Having the same data as every other organization in your state, the way DCC is providing California’s cannabis companies, certainly has its benefits. But being able to scale the product to suit your company’s individual needs is what can truly set your organization apart.