There’s been a lot of talk about the “Tripledemic” that healthcare professionals are fearing this winter. Not only are we likely to face another wave of COVID-19 infections, but that will likely collide with a surge of flu and respiratory syncytial virus (RSV) infections.
Already, RSV and the flu are starting to overwhelm capacity in many adult and pediatric hospitals. This problem is exacerbated by the staff shortages that many hospitals are currently facing.
How your hospital or health system better manage the influx of patients at your facilities and more adeptly respond to challenges such as bed management, staffing, and efficiency of care? Here are 5 metrics that are important to track that will help your organization optimize operations and patient care during the Tripledemic.
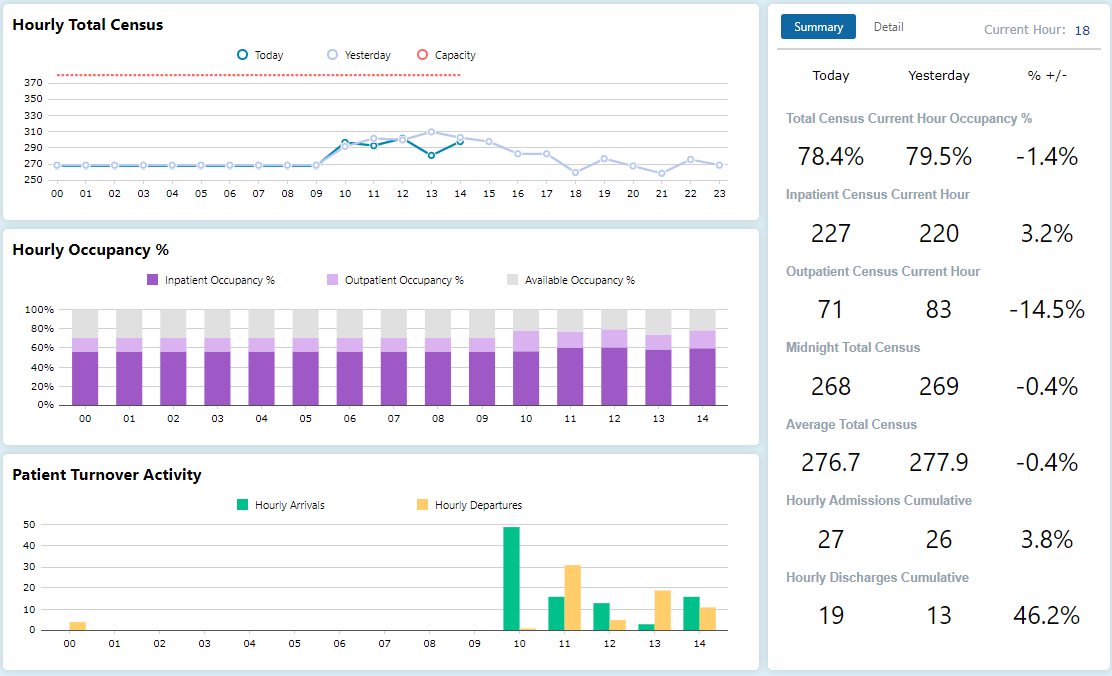
1. Census
Your health system needs to know how many people are in your facilities and how close they are to capacity. Keeping close tabs on the census allows you to understand how you need to best allocate resources.
With the ability to drill-down and view where people are in your hospital and the capacity of different departments, you can shift staffing resources to those areas that have the greatest need.
2. Length of stay
How long are patients staying in your hospital? And what is the length of stay for COVID/flu/RSV patients compared to those in the hospital for other reasons?
Understanding length of stay and the differences between patient cohorts will help you better anticipate staffing and bed needs during times of surge, which in turn, will help you better care for patients.
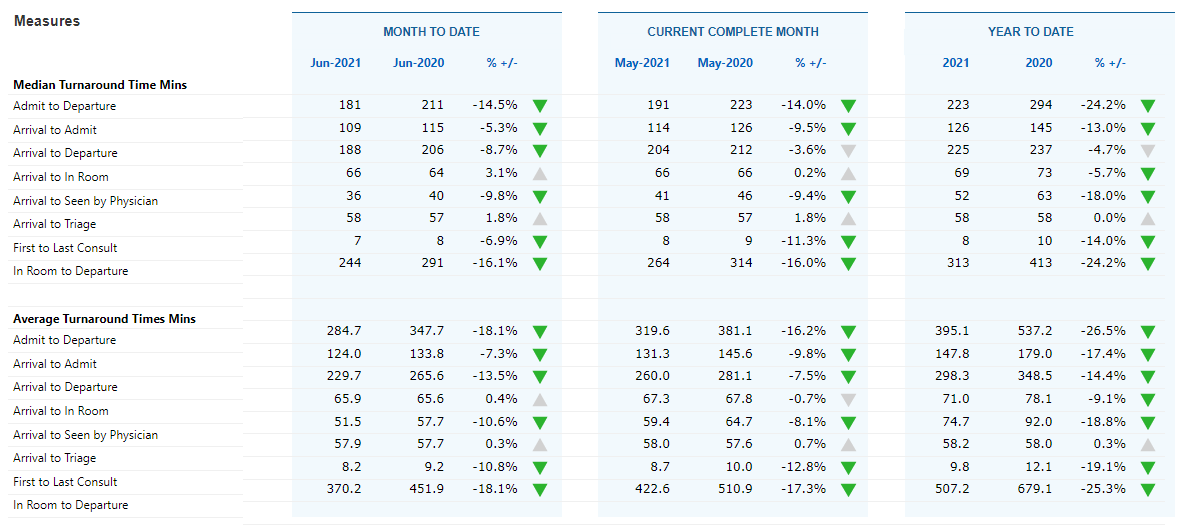
3. Throughput
Once someone checks into your ER, how long does it take them to be triaged? And from there, how long does it take them to be seen by a doctor? With so many ERs overwhelmed by patients these days, it’s important to know how to move patients through the system more quickly. Monitoring throughput data can help identify bottlenecks in the system.
Once your hospital takes notice of areas of concern, you can more effectively pinpoint areas for improvement and shift resources to address throughput issues.
4. Test results
Hospitals not only need to worry about their sick patients, but they also have to worry about the well-being of their staff, and make sure they don’t become sick themselves or inadvertently spread illness to others.
With analytical systems, you can visualize and easily access test results of your patient and employee populations, and see how many positive patients you have for certain illnesses. Noticing upticks in cases or percentage of tests that are positive can indicate spread in your hospital or spread in the community that is starting to reach your doors. Better understanding these numbers allows you to make appropriate decisions around isolating patients or providing the right levels of care.
5. Community spread
One way you can determine whether your hospital will have a surge of patients is to look at what’s happening in the community around you. Since hospital admissions numbers trail positive results in the community, noticing upward trends in your area can help you anticipate surges in your ER.
On its COVID-19 Tracker, Munson Healthcare displays COVID data, both confirmed and probable cases, from the entire state of Michigan. This data, which is made public on Munson’s website, is useful to both hospital staff and the wider community, as it enables people to see surges and declines in case numbers, letting them make appropriate decisions about either hospital operations or their own personal risk level and comfort with being around others.
In addition, Munson displays cumulative cases in its care region in a heat map so it can track where there are more or fewer cases in the community.
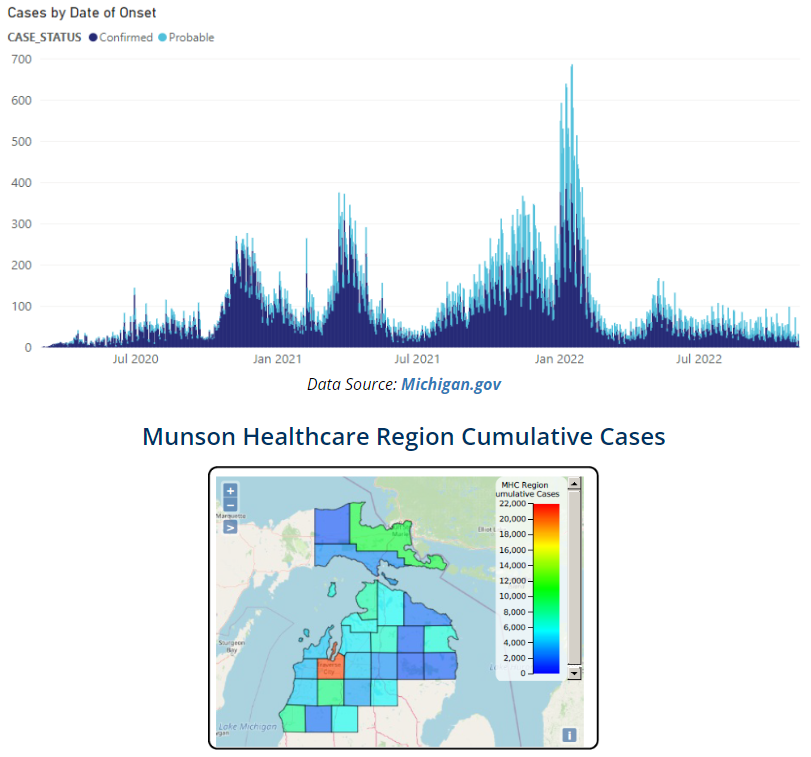
Source: Munson Healthcare COVID-19 Tracker, https://www.munsonhealthcare.org/services/community-health/covid19/munson-healthcare-covid-19-tracker
Similar dashboards could show data in other ways, such as using a heat map to display current case numbers instead of historical numbers. This could enable health systems to shift resources to hospitals in its system that are seeing greater case numbers, and could allow systems to anticipate surges ahead of time based on upticks it starts to see in the data.
Conclusion
It is a challenging time for healthcare professionals, given staffing shortages and a looming Tripledemic on the horizon. An analytics dashboard certainly can’t cure these problems. But keeping tabs on the right metrics can help you make smarter decisions about where to focus your resources and how to better anticipate needs in order to provide the best possible patient care.

- We Have Epic. Why Are We Still Arguing About Our Numbers? - June 23, 2026
- Is Your Data AI-Ready? A Beverage Alcohol Assessment Guide - June 16, 2026
- The Governed Analytics Layer: The Missing Architecture Between Data and Decisions - June 9, 2026