There’s no shortage of data and information. It’s everywhere. But how can you make data useful in order to make better decisions? That’s the hard part.
There are several key metrics that distributors should track in order to improve their businesses. Following are three of these metrics, with examples of reports that Dimensional Insight has developed for our wine and spirits distributors so that they can be easily accessed and analyzed.
1. Product trends
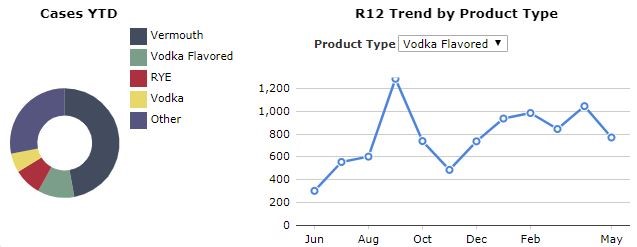
* These graphs are based on hypothetical data.
Wine and spirits distributors are continually trying to optimize their product portfolio. The above trend chart helps them identify potential product changes so they can do so. The doughnut chart on the left shows volume by product category while the line chart on the right shows how product category sales are trending over time. When looking at the doughnut chart, we can see the flavored vodka category has the 2nd most sales in volume with vermouth having the most sales.
When looking at the line chart on the right, we can see that monthly sales for flavored vodka are generally trending upward. This upward trend might indicate it is time to add more flavored vodka products to the distributor’s portfolio. But, before making that decision, it is good to dig deeper. Clicking on the green slice representing flavored vodka will provide a pop-up screen displaying a breakout of flavored vodka products and the volume sales for each.
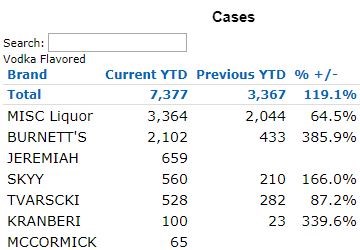
From this breakout of cases by brand, it appears that two new brands were added. The next question is: are sales for this category are up because the two new brands were added or because the category is up overall? We can investigate by comparing sales between this year and last year. The “Total” line shows this year’s sales are just over double last year’s sales (7,377 vs 3,367). Therefore, this year’s increase in sales for the category is 3,970. The two new brands (Jeremiah & McCormick) contributed 724 cases to the total volume (659 + 65). Since the total increase in category sales (3,970) is about five times larger than sales for the two new brands (724), it appears that the increase in sales is due to an increase in demand for the category, not just the addition of two new brands. It might be time to consider adding new products to the flavored vodka category.
2. Monitoring new and lost accounts
Where are you winning accounts? Where are you losing them? Are you making enough new business to make up for what was lost? All of this is critical information that a wine and spirits distributor needs to know.
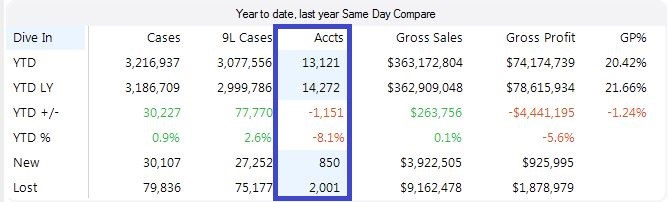
Dimensional Insight’s Distributor Advisor is an interactive mobile app which can help maximize placements through monitoring of new and lost accounts. The above graphic shows Distributor Advisor’s Overview dashboard page. From the screenshot above, we can see there are 850 new accounts for this year (YTD). However, just below that, there are 2,001 lost accounts year to date. That’s more than twice as many lost accounts as new ones! If this ratio of new accounts to lost accounts continues, the distributor will likely go out of business.
Fortunately, Distributor Advisor can be used to help get back some of those lost accounts. Start by clicking on the 2,001 number to pull a list of lost accounts. Distributor Advisor then lets you pull up details about each of the accounts like address, phone number, what products they purchased, and how much of each product. Now, you as a sales rep are empowered with this information to reach out to the account and win it back.
3. Gross profit dollars and GP%
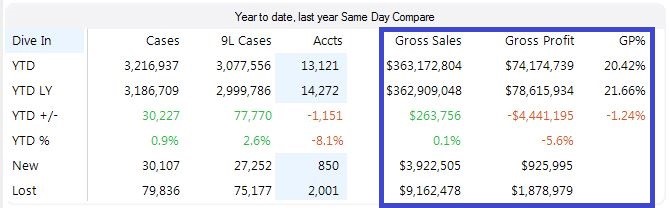
While placements and volume sales are invaluable metrics, it all comes down to the bottom line. Distributors need to make a profit. The same Overview dashboard that provides a snapshot of new and lost accounts also shows Gross Sales (Revenue), Gross Profit, and Gross Profit Percent (GP%).
The gross profit percentage is a great gauge for quickly measuring how well your company’s operations are running. If GP% is around the industry average or above, then operations are probably running smoothly. An average gross profit percentage on wine products has traditionally been around 18%. For liquor products, it has been around 30%. In this example, the gross profit percentage is at 20.42%. Assuming the distributor sells mostly wine, it is probably doing fine. If the distributor is selling mostly liquor, it may need to investigate how to improve operational processes.
This is just the beginning
Of course, there are many other metrics that distributors should track in order to gain insights. These metrics, however, will get you headed on the right path to grow sales and revenue.

- 3 Essential Metrics for Beverage Alcohol Suppliers - May 14, 2024
- How Stamps Can Help You Make More Informed Business Decisions - January 13, 2020
- 3 Critical Metrics for Distributors - July 18, 2019