
Whether we are walking through a familiar neighborhood or driving on a highway during a daily commute, we all recognize danger zones. This curve is dangerous. People always go too fast down this street. No one stops at this crosswalk. The observations are anecdotal, but when accidents happen at those locations, people often aren’t too surprised.
Sometimes, officials work to get more than anecdotal data about those dangerous spots and then use that information to take action. This can apply everywhere from car crashes on busy highways to streets with high levels of pedestrian traffic. Let’s take a look at some of the instances where data is used to make a difference in road safety, and how your organization can use data in a similar way to make improvements.
Somerville streets are safer
Somerville, Massachusetts is the most densely populated city in New England. The city has successfully made changes to make sure its streets – which see heavy bike and foot traffic – are safe. Somerville has seen serious crashes drop 50 percent in 2025 from the previous year, and it has been four years since a traffic collision in the city resulted in a fatality. For comparison, according to the Boston Globe, at least 48 people have died in Boston traffic incidents in that same timeframe.
Somerville officials have pushed through traffic measures on city-controlled streets including speed bumps, more signs, clearer markings showing road boundaries, and barriers between bike paths and car traffic. Data shows these are some of the types of interventions that have proven successful at slowing down cars and keeping pedestrians safe.
Using “the right resources and data” to prevent crashes
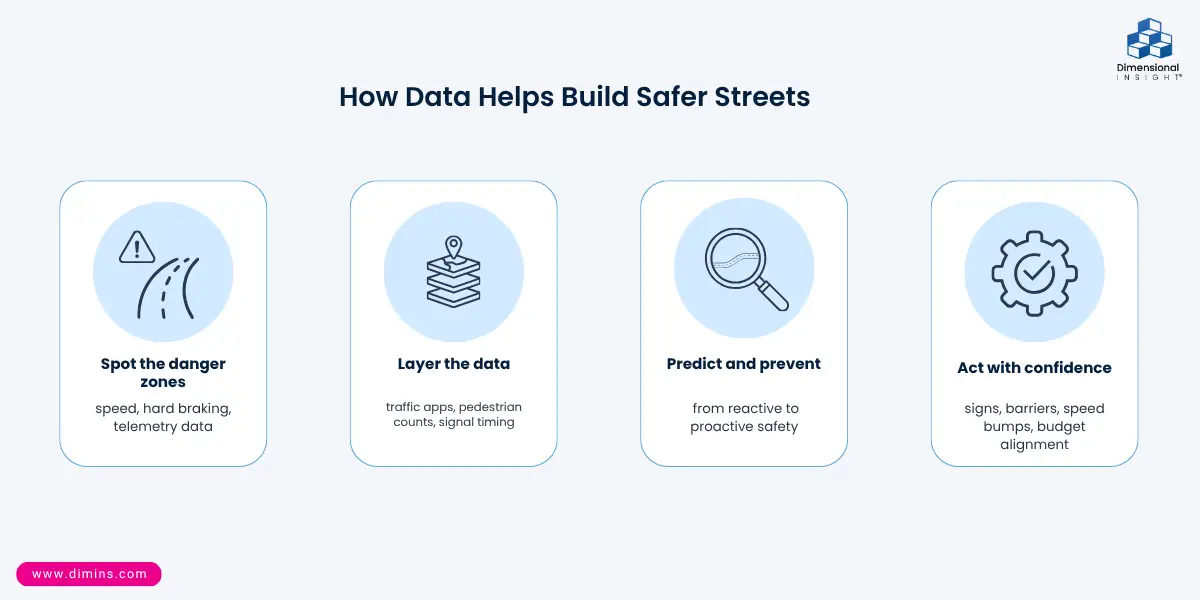
Somerville’s approach is the one encouraged by a recent report released by the Governors Highway Safety Association. A Data-Driven Action Plan for Safer Roads “presents one of the clearest cases yet for moving from reactive safety strategies to proactive ones powered by data and AI…Crashes can be both predicted and prevented with the right resources and data.”
Some of the data used to help assess risk includes rates of speed and hard braking, which are gathered through vehicle telemetry systems. Hard braking can also indicate pedestrian safety measures are needed because a sign may be blocked by tree growth or there might be faded paint that prevents drivers from slowing down ahead of an area where pedestrians are crossing a street.
Data from traffic apps can also help indicate where cars are being forced to stop. Putting all of the data together on a map could show, for example, popular areas where people are crossing a street in the middle of a block. The study recommends action be taken in situations like this, whether that is through a barrier preventing crossings or signs indicating where a crosswalk is for a safer crossing.
An analytics solution helps decision-makers
The decisions about where to put new signs or traffic signals or speed bumps all rely on data, and that data needs to be combined so officials can act on it. Information about how long it takes for a traffic light to stay green, for example, can help with some decisions, but it is more valuable when it is compared with the number of pedestrians approaching the light at a certain time. It’s yet more valuable when the same information about cars and bikes is brought into the equation. These changes cost money, whether that’s hiring new workers or bringing in materials. Financial data also needs to be considered when major changes are made.
Your organization is probably working with different data points, but the methodology is the same: your data often needs to be combined with information from outside sources to produce the best results. To do that, you need a reliable analytics solution that can bring together data from disparate sources to produce one single version of truth that allows decision-makers to confidently draw conclusions. That data can range across departments, depending on the industry, but with the right analytics solution it can include all of your financial information as well.
Data by itself can be impactful – many cities provide statistics on their Vision Zero pages to emphasize the need for change. The most effective results, though, are when that data can tell a convincing story. The people who use the data that matters most to paint a picture are the ones who are most likely going to get more from their data. The right analytics solution can help you present your data in a way that can create the kind of change you are looking for, whether that’s operating more efficiently, or making people safer on city streets.

- Proper Data Governance Prevents Data Slop - October 8, 2026
- Tracking Shipping Price Changes with Analytics - October 1, 2026
- AI: The Good, The Bad (and Scary), and the Analytics - September 24, 2026