
The term “data mapping” can be confusing because it can refer to two things. One is the process of moving data between systems. The ability to map data in this sense is one of the most important parts of a business intelligence tool. It includes governance of the data, and allows users to trust the data they are seeing as an end result.
But data mapping can also refer to information that can be gathered from the visualization of spaces – putting data onto actual maps. You need the first kind of data mapping in order to make sense of the second. Here’s some of what organizations can accomplish by mapping data, but only after integrating that data into their own systems.
How can a map help you understand your data?
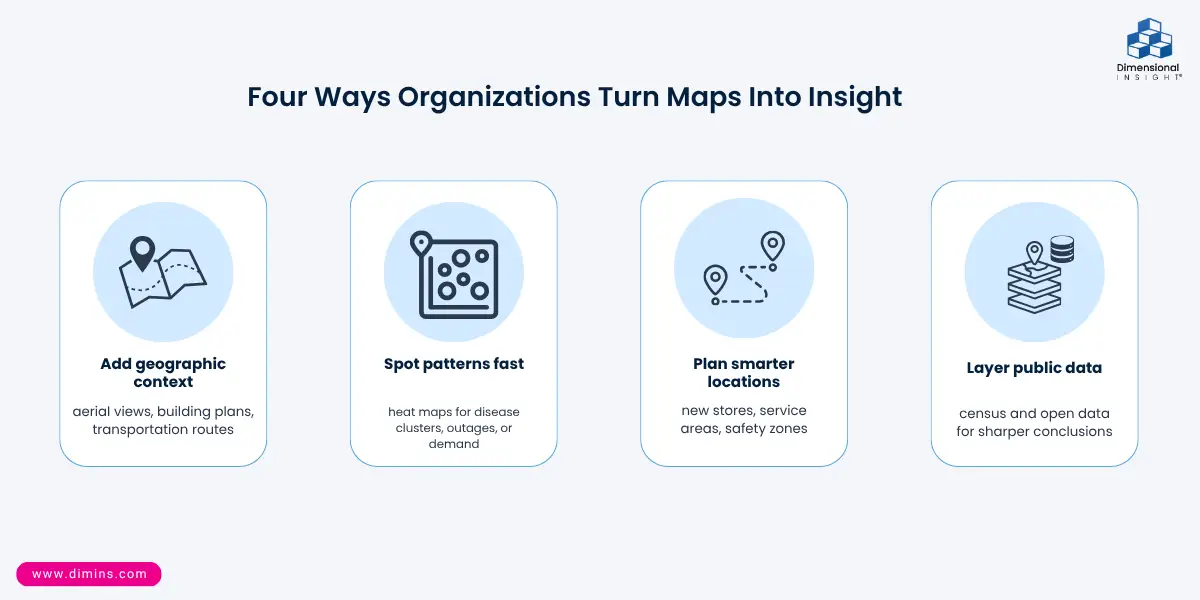
Combining maps and data can help provide context that the numbers can’t show by themselves. Geographic information systems (GIS) can gather different data points such as aerial overviews, building plans, or transportation routes that can help an organization with planning and decision-making. Using overlays, users can compare different aspects of whatever they are looking at to help draw conclusions. In many cases, visualizing the data using maps can help audiences better understand the impact of certain decisions.
How do organizations use maps with their data?
There are many instances of organizations using maps to help them better understand data. Healthcare organizations use heat maps to help them zero in on areas where diseases tend to be prevalent, and they use that information to take action to try to improve health outcomes. Shipping companies can compare routes at different times to maximize efficiency. Utilities organizations use maps to figure out what areas most need preventative maintenance due to tree growth, for example, or to highlight which areas are most susceptible to disruptions.
Organizations combine maps and data for a wide range of purposes. They can simply be for sales, where a store can analyze the market, seeing where there is a need for their product based on the other businesses nearby, or by an organization looking to see if adding a new store in one area is too close to another of its stores and would hurt business there. They can also use maps to study customers’ buying habits geographically. Uses can range from safety measures, mapping out areas surrounding a construction site, for example, to how best to use spaces within a building, such as a hospital.
The right solution
None of this can be done without bringing together all of the data points – both the maps and the relevant information from other systems – using a business intelligence solution. The right solution needs to be able to seamlessly integrate different data points from different sources to produce results that make sense. Having detailed maps doesn’t matter if you can’t use the map information to help provide context to your own internal data. Some organizations also bring in census information or other publicly-available data that can help them draw even more specific geographic conclusions. The right solution can work with all of that data to produce actionable results.
While maps themselves provide a different way to view data, there are still different ways of visualizing the results they can produce. Heat maps, 3-D analysis, and overlays can all present different views of information to help illustrate the conclusions an organization is trying to convey. The more variety an analytics solution can offer in terms of visualizations, the better it is for expressing results.
The best analytics solutions are fast, flexible, and scalable. Working with many different data sources to quickly produce results is one benefit. Imagine trying to work with numbers on a spreadsheet and then looking at the map of an area to analyze sales, for example, and then compare that to instant results using an analytics solution. What happens after that is just as important. A scalable solution can grow with your organization. When one goal is met, it can be readjusted to work with different data to help achieve even more.
When choosing an analytics solution there is so much to consider. It is important to think about the data that means the most to your organization, and match the solution to your needs. If geography matters, how that business intelligence product interacts with maps and data is important. The right analytics solution can help your organization use maps to paint a more detailed picture of your data.

- Tracking Shipping Price Changes with Analytics - October 1, 2026
- AI: The Good, The Bad (and Scary), and the Analytics - September 24, 2026
- Analytics Drives Creative Solutions to Utilities Industry Challenges - September 17, 2026