 Dimensional Insight’s powerful Diver Platform puts extensive data visualization options at your fingertips. It provides quick access to large volumes of data and dashboards that help you transform insights into measurable information. So, wouldn’t it be great if Diver could integrate statistics into dashboards? Well, it can!
In this blog post, we will show you how to leverage the muscle of R, the data scientist’s go-to statistical computing and graphics language, with Diver. With R, you can have interactive forecasts and predictive functionality right in your DivePort dashboards.
What you can do with statistics?
Statistics has the power to help you achieve two goals: first, to explain the past, and second, to predict the future. With Diver, you have large volumes of data ripe for statistical analysis. The following three kinds of analysis, as defined by Wikipedia, highlight a few kinds of analysis that can be applied to your data.
Regression analysis. “Regression analysis is a statistical process for estimating the relationships among variables.” As shown in Figure 1 and Figure 2, regression analysis can be used for forecasting and trend analysis, such as to identify seasonal sales patterns or flu outbreaks.
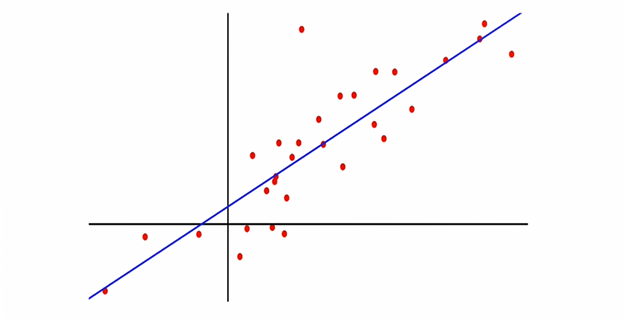
Figure 1: Linear regression analysis example
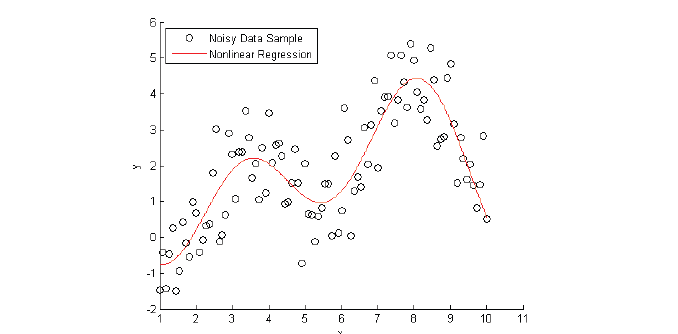
Figure 2: Trend analysis example
Clustering. “Cluster analysis or clustering is the task of grouping a set of objects in such a way that objects in the same group (called a cluster) are more similar (in some sense or another) to each other than to those in other groups (clusters).” As shown in Figure 3, clustering provides a way to find patterns in your data and to predict group membership.
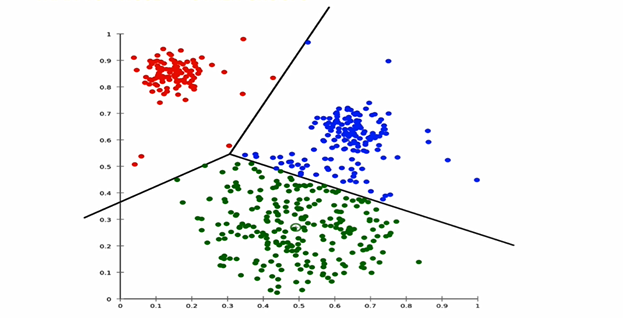
Figure 3: Clustering example
Anomaly detection. “Anomaly detection is the identification of items, events, or observations which do not conform to an expected pattern or other items in a dataset.” As shown in Figure 4, anomaly or outlier detection helps you with data cleansing and fraud detection because it detects values in a dataset that might be incorrect.
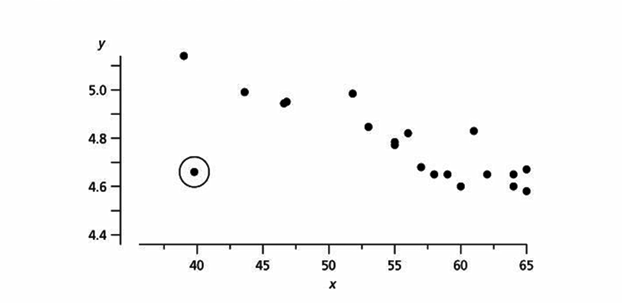
Figure 4: Anomaly detection example
Here are some applications of how you might use statistical analysis with Diver and R to solve some common problems.
- Automated warnings based on existing values, such stock or inventory levels
- Forecast important PKIs, such as hospital readmissions
- Predict the occurrence of events, such as post-operative wound infections
- Identify incorrect data points before errors influence your dashboards
What tools and Diver components do you use to create an application that includes statistics?
Here are the main components to create an application in Diver that incorporates statistical analysis:
- R language and environment for statistical programming
- DI-Production process management component of Diver Platform
- Optional: DI-Production extensions to standardize and reuse code
What is R?
R is an open source programming language and development environment designed for statistical computing that is used widely in data analysis. The language has extensive graphics facilities including the commonly used plot() function as well as other graphics functions for different types of graphs. There’s a gigantic community of users who create packages and functional libraries that are centrally stored and publicly available that you can use in the R programs that you incorporate into Diver.
What is DI-Production?
DI-Production is a process flow management tool that you can automate to combine your scripts. If you have Dimensional Insight scripts running, it’s likely that you’re already using DI-Production.
DI-Production has four basic different kinds of functionality.
- Runs scripts that are made up of nodes, such as process and control nodes. Examples of scripts are integrator scripts, builder scripts, or scripts that you can run from the command line.
- Performs some file system functionality such as copying and moving files or downloading files from FTP.
- Performs conditional logic and parallel computing, which means that you can have logic in your scripts such as if-then control statements. For example, if there are new files, then build all models concurrently to increases the rate of computation.
- Supports alert of issues and failures in a process. For example, if a script node fails due to validation errors, then DI-Production sends an email to the owner of the issue.
What are DI-Production extensions?
DI-Production extensions allow you to create your own nodes and a script that calls those nodes. You can then install the script as an extension on a DiveLine server to make the extension available for any DI-Production script that runs on that server. In the case of integrating R with Diver, you create a script with a node that runs an R program and install that script as an extension. Then, others can create scripts that call the extension and run the R program.
The big benefit of using DI-Production extensions to run R programs is that not everyone needs to be an expert in R or an expert in statistics. With DI-Production extensions, you add a layer of abstraction. You need only one person to develop the R program and install the DI-Production script that calls the R program on your DiveLine server as an extension. Then, anyone with access can develop DivePort pages that call the extension and embed the powerful statistical analysis — all without knowing R programming or even knowing where R is installed on your server.
How do you build statistical functionality with Diver and R?
With a few steps, you can integrate Diver and R and produce dashboards that incorporate statistical analysis. Except for creating your R program, you can develop and manage your applications in Dimensional Insight 7.x Workbench with Production, which is an integrated component of Workbench that replaces the stand-alone DI-Production tool from earlier versions. For earlier versions, use the DI-Production tool. Here are the steps at a high level.
- Create a parameterized R program that does the desired analysis on your datasets. In the program, accept input parameters so that the program is generic for use with various inputs.
- Create a Production Script that calls the R program.
- Optional: Create and install the production script as an extension that accepts input parameters.
- Optional: Include the extension in a production script that passes parameter values to the extension.
Let’s go through these steps with a simple R program that uses input parameters and some screen shots of the Workbench interface.
Step 1: Sample R program
The following sample R program, fileIO.r, is a basic program that reads a file and writes it to another location. The program doesn’t do any statistical calculations, but it is parameterized to take input arguments for the working directory and the locations of the input and output files. Using parameters generalizes the R program so that someone calling the program can indicate where the files are located rather than use statically named files. One caveat with this program, the file locations must be in the specified working directory or in a directory that is under the working directory. Here’s the program.
## Example: fileIO.r: Parametrized R program that reads a file from one location and writes it to another location
## Read the arguments that are supplied when the R program is evoked.
args <- commandArgs(trailingOnly = TRUE)
## Assign the arguments to variables where args[1] is the working directory under which the files are located, args[2] is the input file name, and args[3] is the output file name.
working_dir <- args[1]
input_path <- args[2]
output_path <- args[3]
## Set the working directory. The input and output files must be in this directory or in a subdirectory of this directory.
setwd(working_dir)
## Read the tab-separated input file as specified in args[2].
data <- read.csv(input_path, sep=” \t “)
## Write the tab-separated output file as specified in args[3]. Do not use quotes in the column names; Do not use row names.
write.table(data, file=output_path, sep=” \t “, col.names=TRUE, quote=FALSE, row.names=FALSE)
Step 2: Create a Production script that calls the R program
Now, in DI-Production, create the Production Script that uses an Execute node to call the R program. Remember that fileIO.r takes three arguments. As you can see in Figure 5, the execute node runs the following command:
C:\R\R-3.3.2\bin\x64\Rscript.exe C:\R\fileIO.r “C:/DI/projects/Test/” “$(input)” “$(output)”
Rscript.exe executes the R program, fileIO.r, which has three arguments. In this example, the working directory, C:/DI/projects/Test/, is hard coded. The input and output file parameters are variables, $(input) and $(output), so that the input and output file locations can be specified when the script is called.
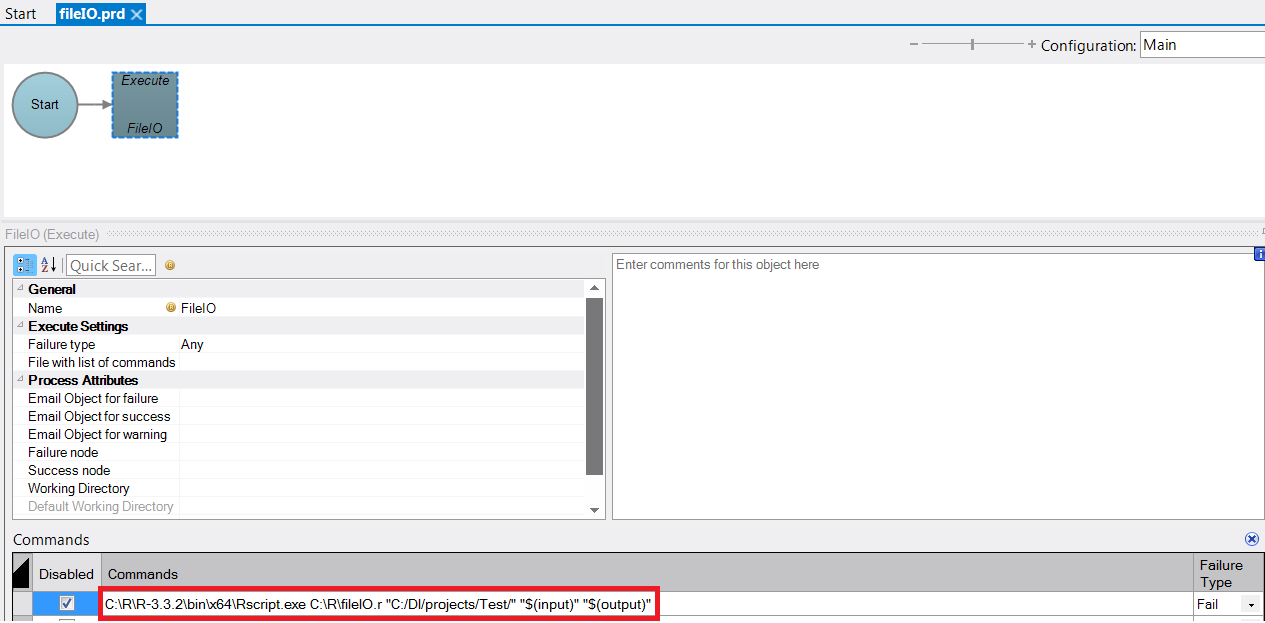
Figure 5: DI-Production script with variable parameters
Now, you have a working DI-Production script that runs your R program with variable input and output. You could stop right here if, for example, you have a one-off program that you don’t need or want to run more regularly. However, for easier, standardized reuse of your code, you can create a DI-Production extension as show in optional Steps 3 and 4. Complete these additional steps and you only select input and output, and everything else is taken care of by the script.
Optional: Step 3: Create and install the DI-Production extension
Now that you have a DI-Production script that calls the R program, you can create and install the DI-Production extension. As you can see in Figure 6, the extension calls the DI-Production script with the variable arguments or with default values that are passed to the script when it is called.
To create the extension in Workbench, use Tools > Extension Editor.
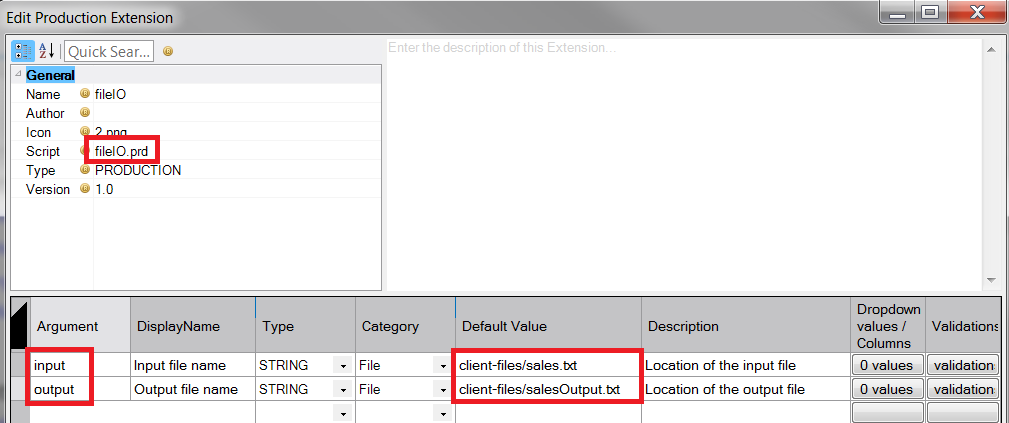
Figure 6: Create DI-Production extension
Now that you have a DI-Production extension created, install it on the DiveLine server. To install the extension in Workbench, use the Production Extensions section of the Tools > Server Settings > Advanced page.
With the R program installed on the server, you can include the extension as a node in various DI-Production scripts and pass different file location arguments to the extension with each call.
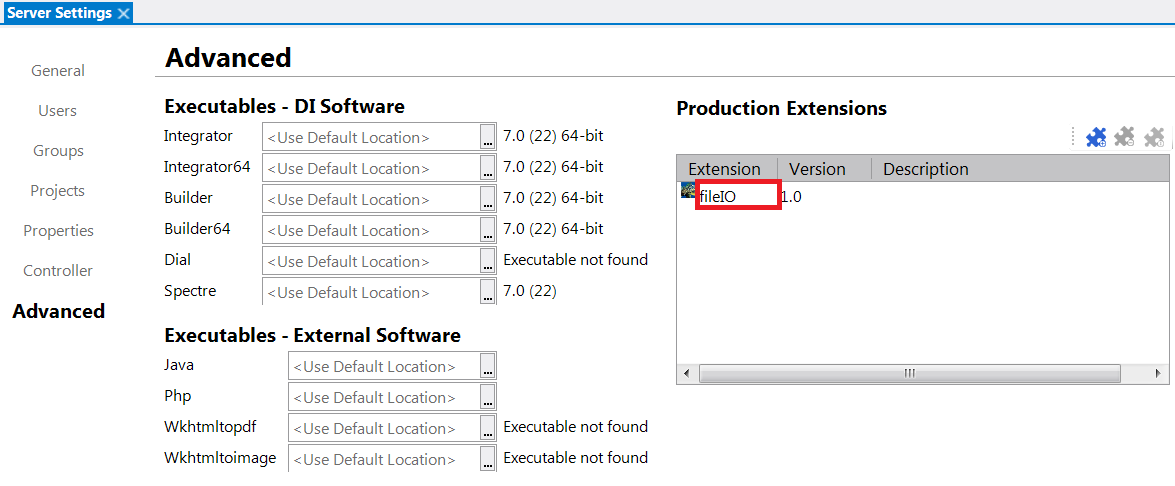
Figure 7: Install DI-Production extension
Optional: Step 4: Include the extension in a Production script
Figure 8 shows a DI-Production script with the extension node in the script. Users of the extension can enter the “Input file name” and “Output file name” values for the parameters that are passed to the extension.
Note that extensions are listed in the Workbench context menu after the Process and Control nodes and can be dragged onto the task flow panel just like other nodes.
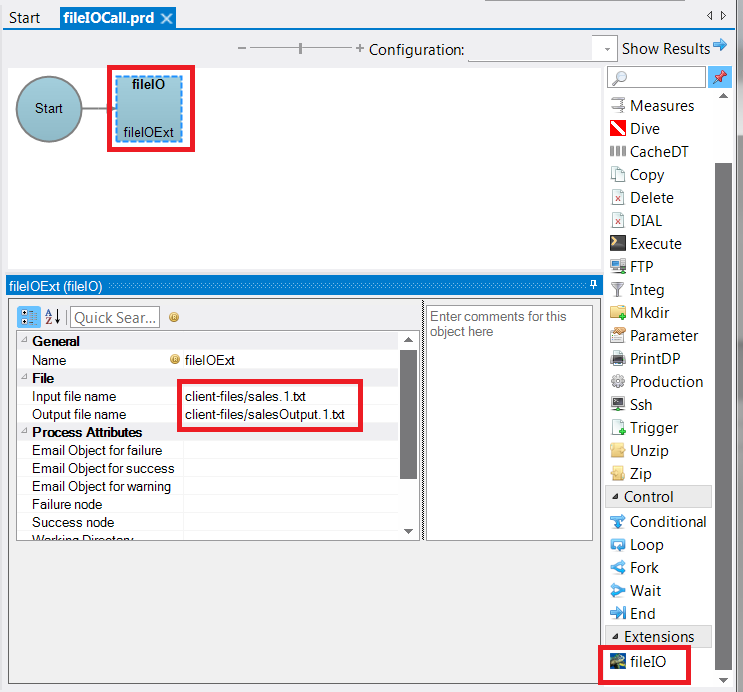
Figure 8: DI-Production script call to the extension with variable values
Troubleshooting
To troubleshoot any errors when running the extension, check the Log file for help. Figure 9 shows the log for a run of the example script. The log shows that the extension is called and returns successfully.
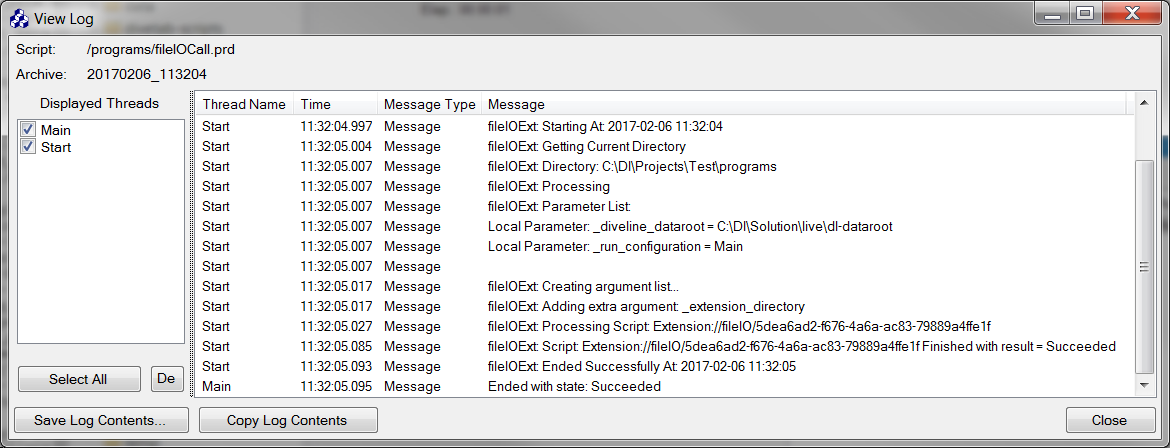
Figure 9: Extension log
Use case: Sales forecast
Let’s put an extension that runs R to work in a sales forecast use case. Suppose a DivePort page provides the monthly sales of cases of merlot wine. The DivePort page can embed the forecast and predictive functionality of R programs into the page and provide interactive forecasts.
The DivePort page in Figure 10 has a sales marker that is based on a tunnel script, which is an Integrator-script that creates a model at run-time. The marker references the tunnel script as if it were an actual model. The marker vertical axis shows the number of cases sold and horizontal axis shows the month.
There’s a free entry QuickView field to enter a custom forecast period. A click action initiates the DI-Production script that takes the data from the sales marker and uses R to create the forecast for the specified number of months and return the result back into the sales data file. A tunnel script rebuilds the model in memory to support the marker, which overwrites the input data with the output data from the R process. When the tunnel script runs for the page refresh, the marker includes the forecast calculations.
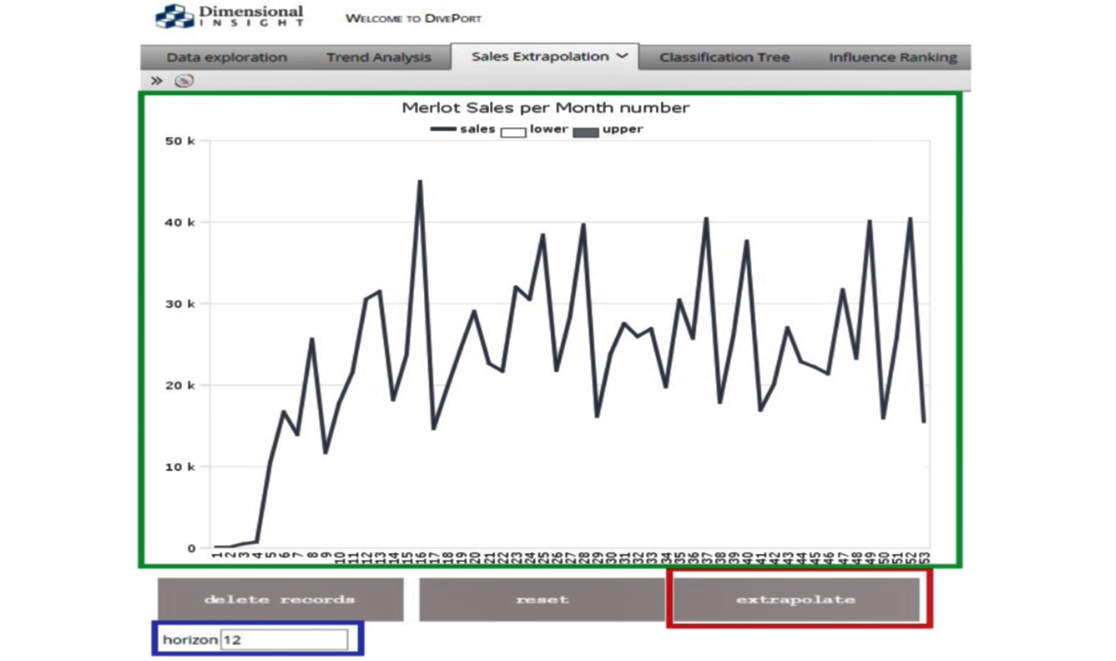
Figure 10: DivePort page with marker, QuickView entry field, and click action to activate the extension
Figure 11 shows the projected expected sales after the page is refreshed. The grey band shows the confidence interval. In this R program, the confidence interval was set to 95%, which means that 19 out of 20 times, the projection is going to be accurate within the band.
The red dots on the graph show a test that was done to see how accurately the forecast projections the sales. For this particular run, a portion of the dataset was used as input. The portion didn’t include the last 10 months of sales data.
The red dots are the actual sales figures for each month, and the forecast overlays the actual sales. You can see that the actual sales fall inside the 95% projected confidence interval and therefore validate the accuracy of the projection.
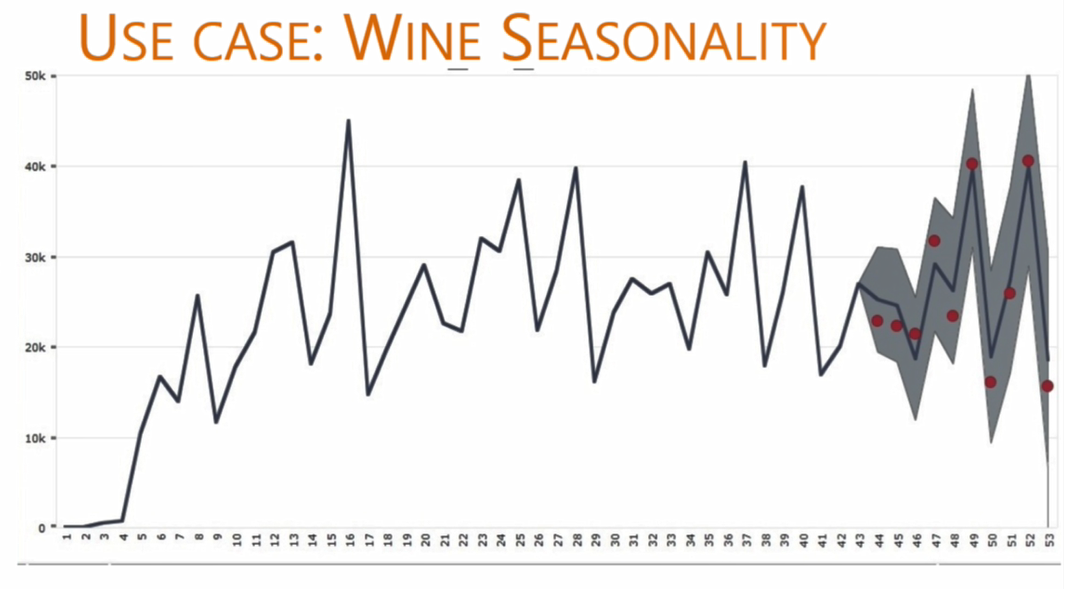
Figure 11: DivePort page with forecast results
This is just one graph showing the power of forecasting when you integrate statistical analysis with Diver. As a possible enhancement, you can make R respond to a QuickView to apply a filter that dynamically updates the displayed data by type of wine such as merlot or sauvignon. This would automatically give you the forecast for that type of wine. Once you have the hang of the tools and process, you can create entire DivePort pages around this functionality.

- How to Access Dimensional Insight Online Help - May 3, 2018
- Learn about Chart Portlet and the Future of Dimensional Insight Visualizations - September 13, 2017
- How to Use Map Portlet to Visualize Geographic Data - August 10, 2017