 As a business intelligence provider, we allow companies to integrate their data from disparate sources and be able to dive into it to get new and surprising insights. With Election Day right around the corner, we decided to do a little fun diving into a data set to see if there were any interesting correlations around political affiliation and drinking preferences.
Here’s what we found: Democrats are 44% more likely than Republicans to drink wine and Republicans are 13% more likely than Democrats to drink beer. When it comes to hard liquor, the difference is less stark, with Democrats 7% more likely than Republicans to drink spirits. So, how did we figure this out?
What we did
We first received a data set from Beverage Marketing Corporation, a leading management consulting firm and research company for the beverage industry. It has a comprehensive database called DrinkTell from which we exported the data. The DrinkTell data set included a state by state breakdown of total volume of beer, wine, and spirits sold for the years 2012-2014. One of our data experts, Bernard Seban, imported that data into Diver Platform and converted each of the numbers into a common unit of measurement.
Once that was set, Bernard also pulled in U.S. Census estimated population data on the number of adults (18+) living in each state so we could calculate per capita consumption for each alcohol segment.
The last piece of information Bernard pulled in to Diver was data on “blue” states vs. “red” states. A variety of factors determine a state’s color, including governorship, state and federal elected officials, and historical voting preferences.
With all this in place, we could do our analysis in Diver.

What the data tells us
Once Bernard found the per capita consumption and matched it to our red state/blue state data, he created a dashboard in DivePort. Here’s how the data looked in a set of tables:
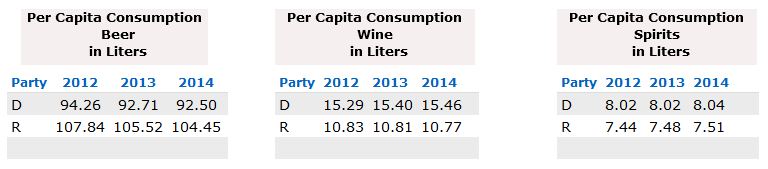
What does this data indicate? Looking at the 2014 numbers (the latest year in which data is available for all categories), the per capita consumption of wine in red states is 10.77 liters and in blue states is 15.46 liters (44% more for blue states). For beer, the per capita consumption for blue states is 92.50 liters, and the per capita consumption of beer in red states is 104.45 liters (13% more for red states). Finally, for spirits, red states’ per capita consumption is 7.51 liters and blue states’ consumption is 8.04 liters (7% more for blue states).
Lessons learned
One thing that is important to note is that correlation does not imply causation. There are a lot of factors that go into alcoholic preferences and/or political preferences! This was a fun election season exercise.
It is fascinating, though, to see what kinds of correlations you can find when you are able to tie together different data sources and then dive into the data in whichever direction you have questions. This is the real power of our Diver Platform.
We’ve learned a lot more from this data set and will continue to share additional information with you in the coming months. In the meantime, is there something you’d like to see in the data? A direction in which you’d like us to dive? Please let us know in the comments below.

- We Have Epic. Why Are We Still Arguing About Our Numbers? - June 23, 2026
- Is Your Data AI-Ready? A Beverage Alcohol Assessment Guide - June 16, 2026
- The Governed Analytics Layer: The Missing Architecture Between Data and Decisions - June 9, 2026