In beverage alcohol, few topics cause more confusion—or more heated internal debate—than this one.
Ask three teams how sales are doing and you may get three different answers. Shipments look strong. Depletions are flat. Sell-through is trending down in a few key chains. Everyone is technically correct—and yet the organization feels misaligned.
This isn’t a data quality problem. It’s a definition problem.
Shipments, depletions, and sell-through are often used interchangeably, but they measure very different moments in the sales lifecycle. When those differences aren’t clearly understood—or worse, when they’re blended together in dashboards—the result is distorted performance reporting and poor decision-making.
In this post, we’ll break down what each metric really means, why confusion is so common, how inconsistent measures skew analytics, and how modern analytics platforms—like those from Dimensional Insight—help organizations unify these views without oversimplifying them.
The Three Metrics, Clearly Defined
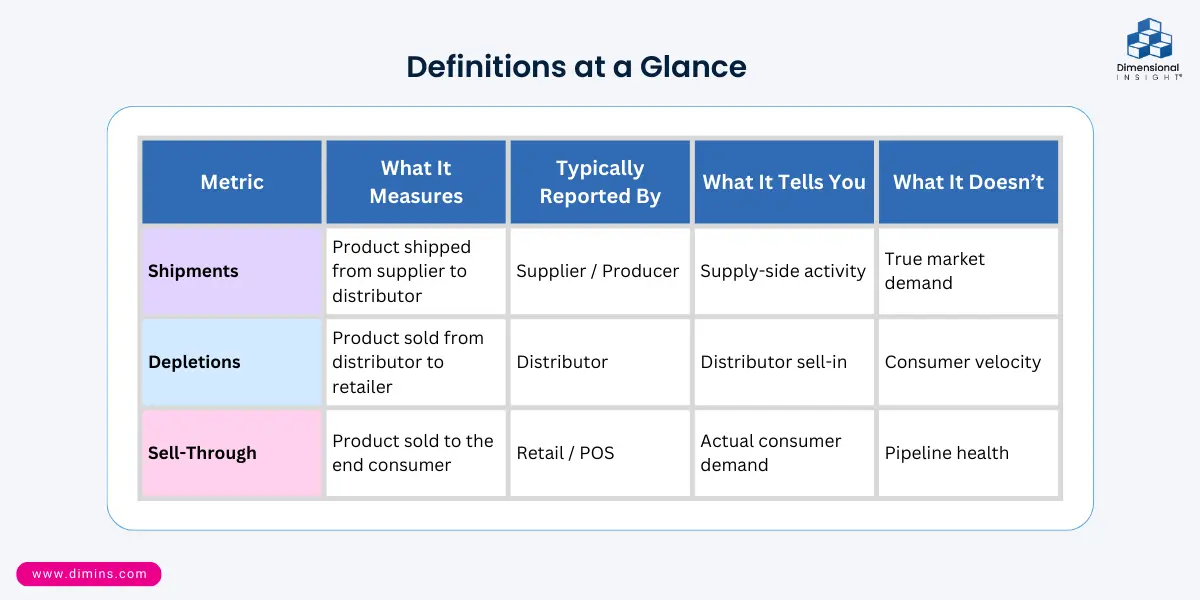
At a high level, shipments, depletions, and sell-through all describe “sales.” But they answer different questions, for different audiences, at different points in the value chain.
| Metric | What It Measures | Typically Reported By | What It Tells You | What It Doesn’t |
| Shipments | Product shipped from supplier to distributor | Supplier / Producer | Supply-side activity | True market demand |
| Depletions | Product sold from distributor to retailer | Distributor | Distributor sell-in | Consumer velocity |
| Sell-Through | Product sold to the end consumer | Retail / POS | Actual consumer demand | Pipeline health |
None of these metrics is “right” or “wrong.” Each reflects a legitimate business reality. Problems arise when they’re treated as interchangeable—or when dashboards don’t make clear which one you’re looking at.
Where These Metrics Sit in the Beverage Alcohol Flow
The beverage alcohol industry’s three-tier system makes this distinction especially important:
- Shipments occur when product moves from supplier to distributor
- Depletions occur when distributors sell to retailers
- Sell-through occurs when consumers purchase at retail
Each step introduces time lag, inventory buildup, and reporting variation. That’s normal. Ignoring those differences is not.

Why Shipments, Depletions, and Sell-Through Get Mixed Up
If this confusion feels universal, that’s because it is.
Most organizations don’t intentionally blur these metrics. It happens organically over time, driven by a few common factors:
- Different teams own different numbers: Sales teams live in depletions. Finance may focus on shipments. Marketing increasingly relies on sell-through.
- Reporting cadence doesn’t match: Shipments may be tracked daily, depletions weekly, and POS monthly—yet they’re shown side by side.
- Spreadsheets flatten nuance: When data is exported and manually combined, definitions get lost.
- Dashboards prioritize simplicity: Executive dashboards often show a single “sales” number, masking what’s underneath.
The result is a single chart attempting to answer too many questions at once—and answering none of them well.
If your dashboard doesn’t tell you what kind of sales you’re looking at, it’s not telling you the full story.
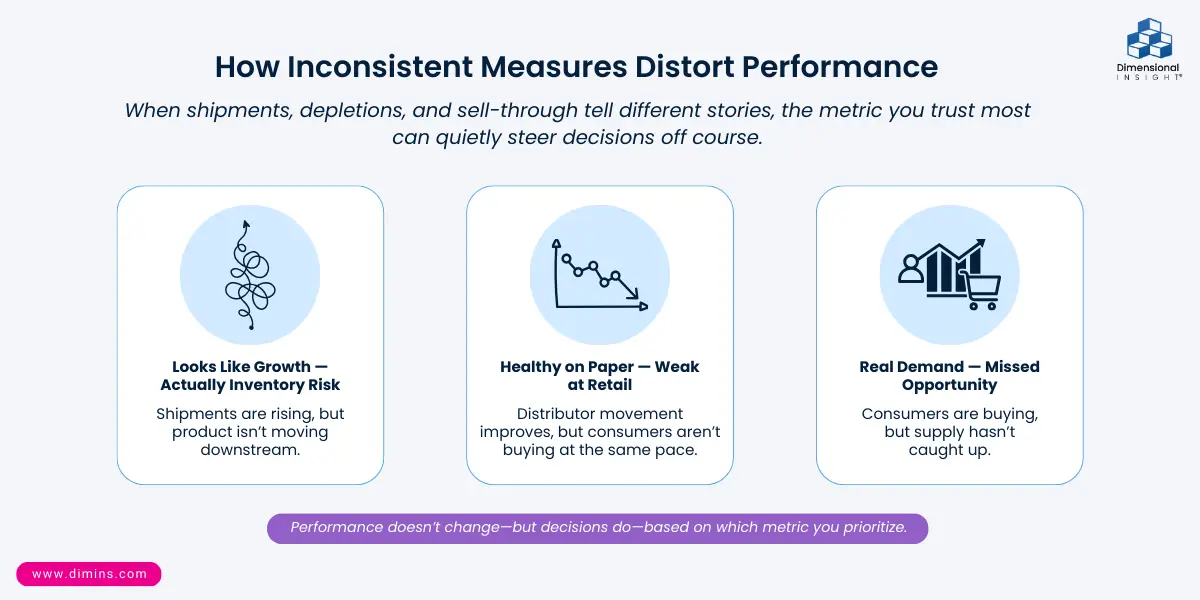
How Inconsistent Measures Distort Performance
Using the wrong metric—or combining metrics without context—can lead to decisions that feel logical but are fundamentally flawed.
Scenario 1: Shipments Are Up, Depletions Are Flat
At first glance, this looks like growth. In reality, it may signal inventory buildup at the distributor level. Production ramps up, but downstream movement hasn’t followed.
Scenario 2: Depletions Are Up, Sell-Through Is Down
This often indicates distributor push without consumer pull. The brand looks healthy in distributor reports, but velocity at retail tells a different story—one that may surface later through returns, discounts, or resets.
Scenario 3: Sell-Through Is Strong, Shipments Lag
Consumer demand is there, but supply hasn’t caught up. This is a missed opportunity that can quietly erode share if not addressed quickly.
Same brand. Same time period. Three very different interpretations—depending on which metric you emphasize.
When Each Metric Is the Right One to Use
The goal isn’t to crown a “best” metric. It’s to use the right metric for the right decision.
Executives
- Look for alignment and divergence across all three
- Trends matter more than absolutes
- One headline number rarely tells the full story
Sales Teams
- Depletions remain the operational backbone
- Use sell-through to prioritize accounts and brands
Supply Chain & Operations
- Shipments and depletions together reveal pipeline health
- Gaps between them are often more informative than either alone
Marketing Teams
- Sell-through shows campaign impact
- Depletions reveal distributor response
The issue isn’t choosing the wrong metric—it’s expecting one metric to answer every question.
Why Analytics Often Make This Worse (Before They Make It Better)
Modern analytics and AI can surface insights faster than ever. But they also amplify inconsistencies if the underlying data model isn’t sound.
When shipments, depletions, and sell-through are:
- Defined differently by region
- Aligned to different calendars
- Stored in separate systems
they become nearly impossible to reconcile downstream.
This is where many organizations stall—not because they lack data, but because they lack clarity.

How Dimensional Insight Approaches the Problem
Rather than forcing these metrics into a single blended number, Dimensional Insight treats them as distinct but connected truths.
That means:
- Preserving the integrity of each metric
- Applying consistent hierarchies, calendars, and units
- Making context explicit in every dashboard
Users don’t have to guess which “sales” they’re looking at. The system makes it clear—and shows how the metrics relate without collapsing them into something misleading.
Instead of reconciling numbers manually, teams spend their time understanding why metrics diverge—and what to do about it.
Frequently Asked Questions
What’s the difference between shipments and depletions?
Shipments measure product sent from suppliers to distributors. Depletions measure product sold from distributors to retailers. The timing and business meaning are different, even though both are often labeled “sales.”
Is sell-through more accurate than depletions?
Sell-through reflects actual consumer purchases, but accuracy depends on the question you’re asking. Depletions are still essential for managing distributor relationships and execution.
Why don’t shipments ever match depletions?
Timing differences, inventory buildup, promotions, and reporting cadence all contribute. A mismatch isn’t inherently bad—it’s often informative.
Which metric should executives focus on?
Executives benefit most from seeing trends across all three metrics, not just one in isolation.
Can AI fix shipments vs depletions confusion?
Only if the underlying data is clearly defined and modeled. AI can accelerate insight—but it can’t fix ambiguous inputs.
Clarity Beats Complexity
Shipments, depletions, and sell-through aren’t interchangeable—and they were never meant to be.
When organizations take the time to define them clearly, keep them distinct, and view them together with context, conversations change. Meetings move from debating whose numbers are right to deciding what actions to take.
Better analytics doesn’t mean fewer metrics. It means clearer ones—and the confidence to act on them.


- What Drives On-Premise Spirits Sales? Lessons from Bartenders, Operators, and Brands - March 17, 2026
- Healthcare Analytics vs. Business Intelligence: What’s the Difference—and Why It Matters - February 3, 2026
- What’s the Difference Between Shipments, Depletions, and Sell-Through—and Why It Matters - January 29, 2026