Organizations today operate in increasingly complex data environments. Systems multiply, spreadsheets proliferate, and teams create their own versions of key metrics. The result isn’t just confusion — it’s the emergence of a parallel reality: a version of your data that looks familiar on the surface but behaves differently underneath.
It’s not unlike the signature tension in Stranger Things: two worlds that mirror each other but diverge in ways that create real danger. As the cultural conversation revives with Season 5’s release, it’s an apt moment to examine how organizations can avoid slipping into their own “Upside Down” — a distorted data landscape where trust erodes and inconsistencies grow unchecked.
This post explores how those distortions form, what “monsters” lurk within them, and how organizations can keep their data environment firmly rooted in the reality they intend.
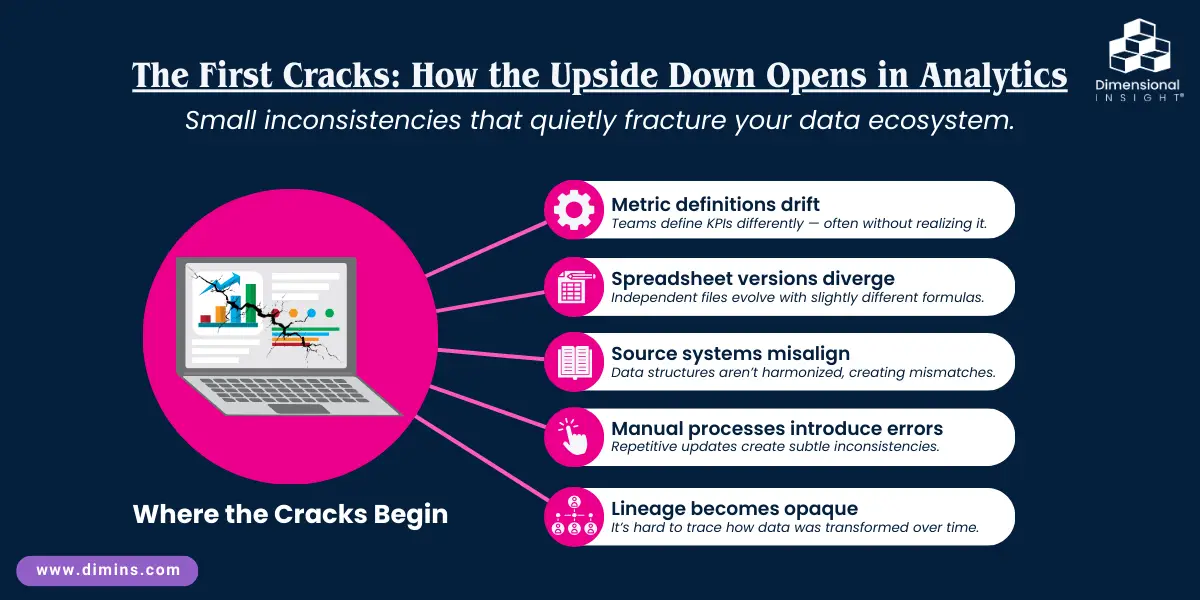
The First Cracks: How the Upside Down Opens in Analytics
In the show, portals between worlds don’t start as dramatic ruptures; they begin as subtle fissures. In data environments, the same thing happens.
Cracks appear when:
- Teams define key metrics differently, often without realizing it
- Spreadsheets evolve independently, each with slightly different formulas
- Source systems aren’t fully harmonized, leading to structural mismatches
- Manual processes introduce inconsistencies, especially when repeated weekly or monthly
- Lineage becomes unclear, making it difficult to trace how data was transformed
None of these issues feel significant in isolation. But over time, they compound. Small discrepancies evolve into parallel definitions. Multiple versions of the truth emerge. And suddenly, leaders encounter dashboards that disagree on what should be simple numbers.

Demodogs, Demogorgons, and Vecna: A Framework for Understanding Data Threats
You don’t need to be caught up on the latest season to recognize the archetypes:
- “Demodogs” — Small Issues That Multiply Quickly
These are the seemingly minor problems:
- Out-of-date extracts
- Local copies of reports
- Slightly different calculations
- Undocumented adjustments
- Dashboards that were built once and never revisited
Individually, each is manageable. Collectively, they create noise, confusion, and mounting effort.
- “Demogorgons” — Larger, More Visible Problems
These are the issues that drain productivity and trust:
- Conflicting dashboards
- Duplicated records
- Stale or incomplete data
- Broken refresh processes
- Metrics that shift subtly from one month to another
These problems often reveal deeper structural weaknesses.
- “Vecna” — The Underlying Force Behind the Distortions
Without delving into plot details, Vecna represents a root cause, not a storyline.
In analytics, that root cause is data silos.
- Silos isolate teams
- They fracture shared understanding
- They allow parallel metrics to emerge and persist unnoticed
Silos don’t simply create errors — they create conditions where errors thrive.
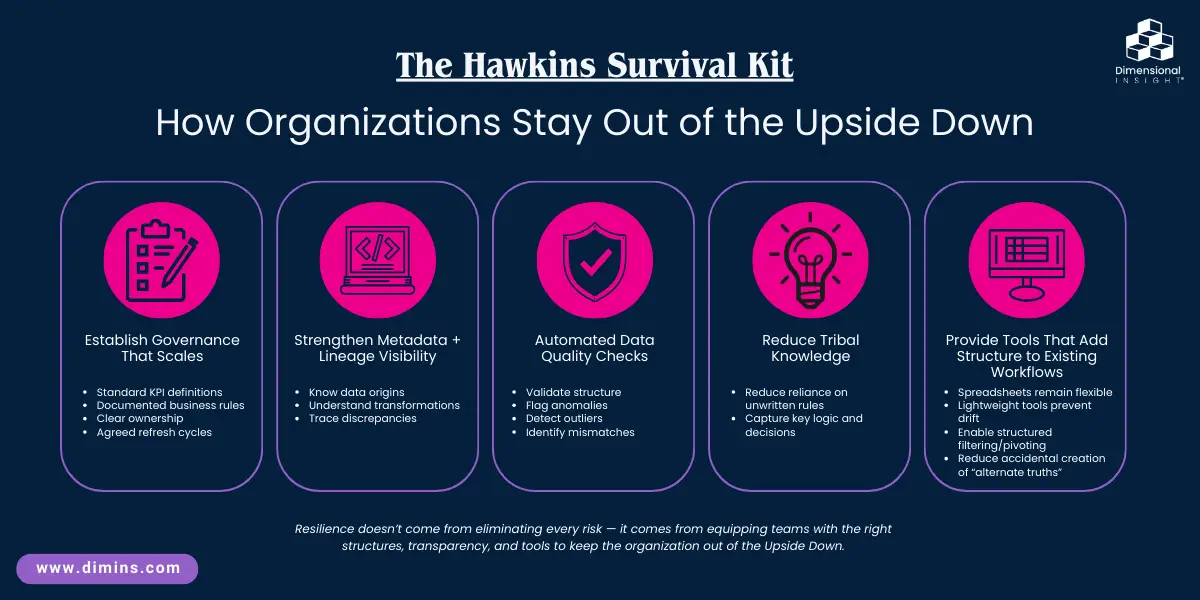
The Hawkins Survival Kit: How Organizations Stay Out of the Upside Down
A strong data environment isn’t about eliminating every risk. It’s about building resilience — the ability to detect inconsistencies early, correct them quickly, and prevent them from multiplying. Here’s how organizations can think about their “survival kits”:
- Establish Governance That Scales with the Organization
Governance should provide clarity without creating friction:
- Standardized KPI definitions
- Documented business rules
- Clear ownership and accountability
- Agreed-upon refresh cadences
Good governance reduces variance and ensures teams describe reality the same way.
- Strengthen Metadata and Lineage Visibility
Transparency is an essential defense:
- Knowing where data comes from
- Understanding how it’s transformed
- Being able to trace discrepancies back to their source
Lineage turns the unknown into the knowable.
- Implement Automated Data Quality Checks
Manual review alone is not enough. Organizations need automated rules that:
- Validate structure
- Flag anomalies
- Detect outliers
- Identify mismatched fields
This creates an early-warning system before issues propagate.
- Reduce Reliance on Undocumented Tribal Knowledge
Documentation doesn’t need to be elaborate — it just needs to exist. When key insights live only in someone’s head, complexity grows unchecked.
- Provide Tools That Add Structure to Existing Workflows
Spreadsheets are indispensable because they’re flexible and familiar — but that same flexibility can also create inconsistencies over time. As teams build more formulas, linked sheets, and manual workarounds, small differences can quietly widen into bigger gaps.
Lightweight analytics tools help prevent that drift. They don’t replace Excel; instead, they provide a simple, consistent way to explore data without requiring advanced functions. By giving users a more guided environment for filtering, pivoting, and reviewing data, these tools reduce the chances that everyday analysis opens an “accidental gate” to a slightly different version of the truth.
The result is clearer, more reliable day-to-day insight — still familiar, but less prone to divergence.

Eleven’s Advantage: The Power of Human + AI Insight
Analytics evolves most effectively when human expertise and AI-driven intelligence come together — not unlike how the Hawkins team amplifies Eleven’s strengths.
Human expertise guides:
- Contextual understanding
- Ethical decision-making
- Business prioritization
- Interpretation and storytelling
AI augments with:
- Pattern recognition
- Rapid anomaly detection
- Forecasting
- Automation of repetitive tasks
The combination accelerates insight generation while improving consistency.

Escaping the Data Upside Down: A Practical, Repeatable Plan
Organizations don’t need supernatural abilities to restore clarity. They need a disciplined approach.
- Inventory your environment: Catalog systems, pipelines, dashboards, and owners.
- Identify inconsistencies: Compare definitions, logic, and structures.
- Standardize the core: Unify definitions. Align formulas. Establish a singular source of truth.
- Strengthen governance: Maintain clear rules, documentation, and ownership.
- Monitor continuously: Quality checks, lineage tracking, and regular audits help prevent regression.
- Support teams with simple, consistent tools: Give people easy, structured ways to work with data — especially spreadsheets — without creating new silos or complexities.
Conclusion: Creating a Data Reality You Can Trust
The intrigue of Stranger Things lies in the tension between two worlds — the one people think they understand and the darker, more distorted version beneath it. Organizations face a similar challenge with their data.
But this isn’t a battle against supernatural forces. It’s a matter of clarity, consistency, and collaboration.
With strong governance, aligned definitions, transparent lineage, AI-augmented workflows, and tools that keep everyday analysis consistent, organizations can keep their data “right-side up.”
You don’t need to fight monsters.
You just need to close the cracks.


- Stranger Data: Navigating the “Upside Down” of Analytics - December 4, 2025
- Meet the Dimensional Insight Team: Chris Pitt - August 14, 2025
- Meet the Dimensional Insight Team:Shaun Foaden - July 17, 2025