
What’s New on the Website
Press coverage
20 Skills Every Communications Professional Will Need By 2027

10.07.26
Press coverage
20 Outdated Corporate Terms To Retire Before 2027

Press coverage
Critical Governance, Ethical, and Regulatory Considerations in Deploying AI Solutions and How to Address Them
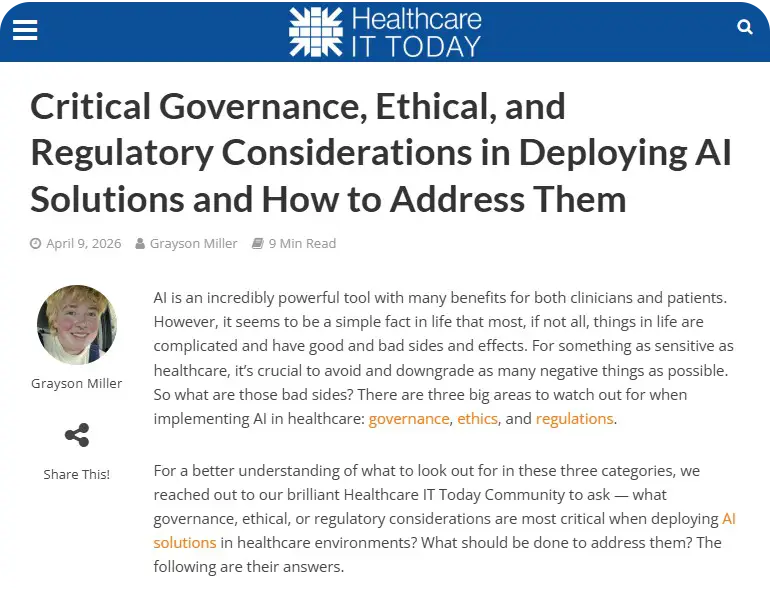
04.01.26
Press coverage
385+ revenue cycle management companies to know | 2026
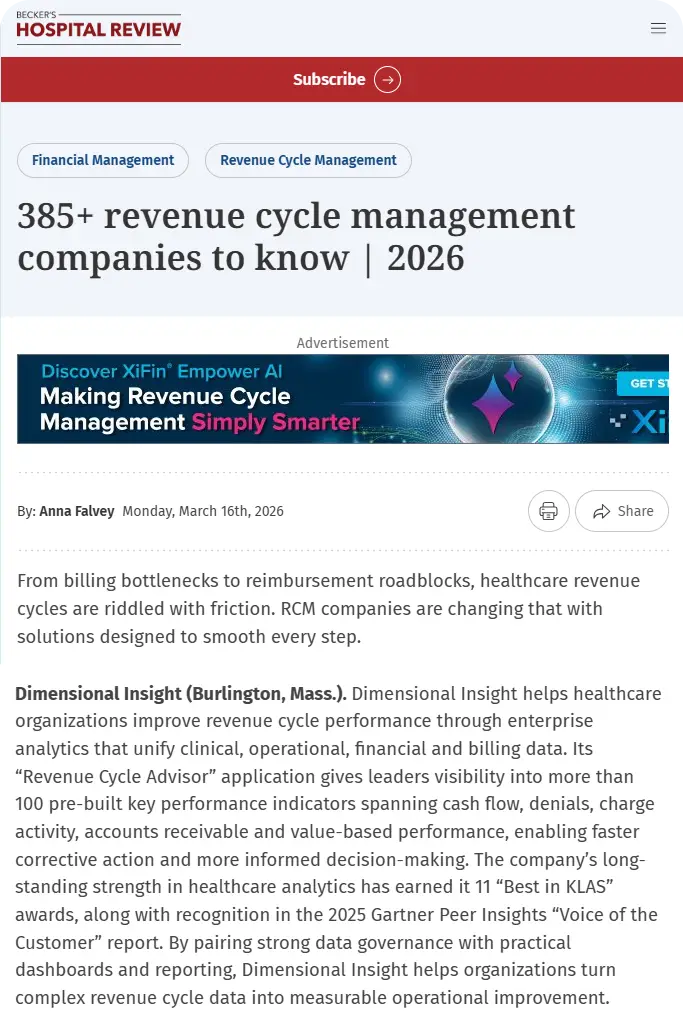
03.31.26
Press coverage
AI Can Quickly Become a Confident Liar. Dimensional Insight Explains How to Prevent It.
Click to read the article
02.17.26
Press coverage
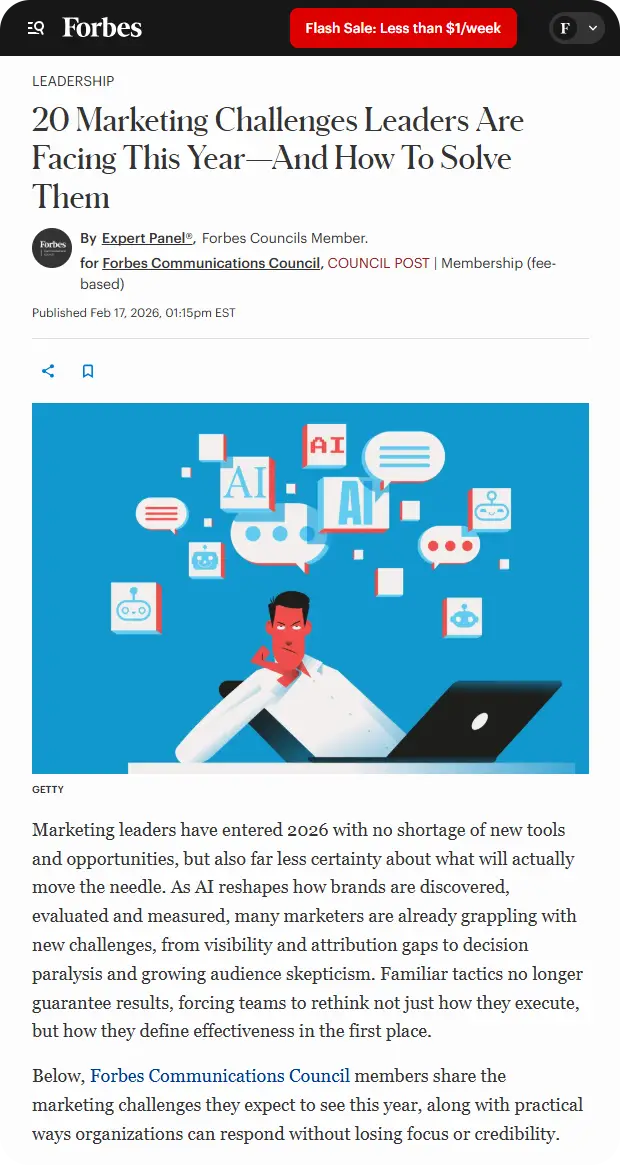
20 Marketing Challenges Leaders Are Facing This Year—And How To Solve Them

New Episode of the Knowledge Forum!
- DivePort: Controlling First-Load Behavior with Defaults
- Squashing vs. Diving: Comparing Spectre Flow and Spectre Dive
Watch new episode →
New Episode of the Knowledge Forum!
- DivePort Page Types
- Crosstab: Brand Analysis in NAVO
Watch new episode →
Press release
Dimensional Insight named a Strong Performer in the 2025 Voice of the Customer for Analytics and BI
Distinction in Gartner Report Is Based on Feedback and Ratings from End-User Professionals
Press release
Dimensional Insight Recognized in KLAS 2025 Consistent High Performers Report
Recognition underscores Dimensional Insight’s long-term commitment to trusted partnerships, measurable outcomes, and customer satisfaction in healthcare analytics
12.05.24
New Episode of the Knowledge Forum!
- Using Program Advisor
Watch new episode →
12.01.25
Press coverage
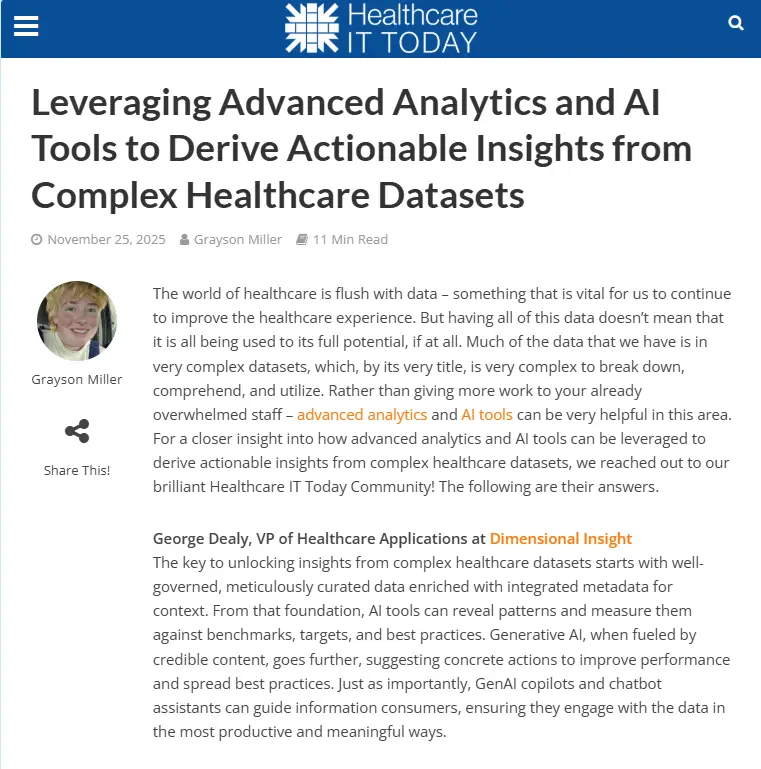
Leveraging Advanced Analytics and AI Tools to Derive Actionable Insights from Complex Healthcare Datasets
News Archive
2025
2024
2023
2022
2021
2020

Data and Analytics can Help Show the Way to Safer Streets
Whether we are walking through a familiar neighborhood or driving on a highway during a daily commute, we all recognize danger zones. This curve is dangerous. People always go too fast down this street. No one stops at this crosswalk. The observations are anecdotal, but when accidents happen at those locations, people often aren’t too surprised.
Sometimes, officials work to get more than anecdotal data about those dangerous spots and then use that information to take action. This can apply everywhere from car crashes on busy highways to streets with high levels of pedestrian traffic. Let’s take a look at some of the instances where data is used to make a difference in road safety, and how your organization can use data in a similar way to make improvements.

The Right Analytics Solution Can Put Your Data on the Map
The term “data mapping” can be confusing because it can refer to two things. One is the process of moving data between systems. The ability to map data in this sense is one of the most important parts of a business intelligence tool. It includes governance of the data, and allows users to trust the data they are seeing as an end result.
But data mapping can also refer to information that can be gathered from the visualization of spaces – putting data onto actual maps. You need the first kind of data mapping in order to make sense of the second. Here’s some of what organizations can accomplish by mapping data, but only after integrating that data into their own systems.