What’s New on the Website
Press coverage
Critical Governance, Ethical, and Regulatory Considerations in Deploying AI Solutions and How to Address Them
04.01.26
Press coverage
385+ revenue cycle management companies to know | 2026
03.31.26
Press coverage
AI Can Quickly Become a Confident Liar. Dimensional Insight Explains How to Prevent It.
Click to read the article
02.17.26
Press coverage
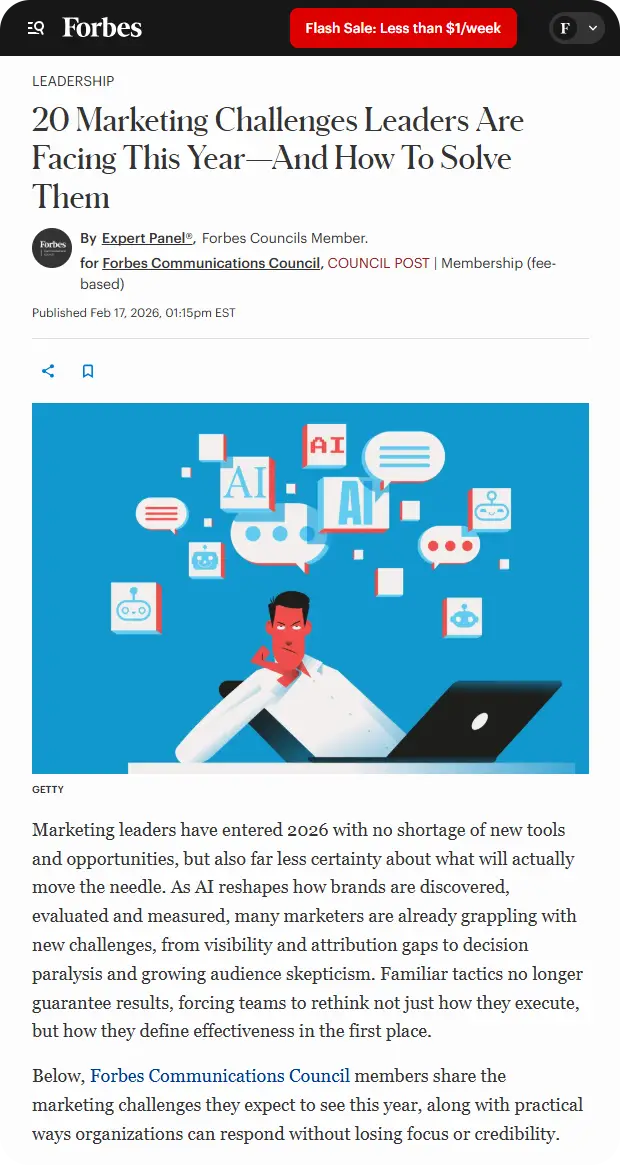
20 Marketing Challenges Leaders Are Facing This Year—And How To Solve Them
New Episode of the Knowledge Forum!
- DivePort: Controlling First-Load Behavior with Defaults
- Squashing vs. Diving: Comparing Spectre Flow and Spectre Dive
Watch new episode →
New Episode of the Knowledge Forum!
- DivePort Page Types
- Crosstab: Brand Analysis in NAVO
Watch new episode →
Press release
Dimensional Insight named a Strong Performer in the 2025 Voice of the Customer for Analytics and BI
Distinction in Gartner Report Is Based on Feedback and Ratings from End-User Professionals
Press release
Dimensional Insight Recognized in KLAS 2025 Consistent High Performers Report
Recognition underscores Dimensional Insight’s long-term commitment to trusted partnerships, measurable outcomes, and customer satisfaction in healthcare analytics
12.05.24![]()
New Episode of the Knowledge Forum!
- Using Program Advisor
Watch new episode →
12.01.25
Press coverage
Leveraging Advanced Analytics and AI Tools to Derive Actionable Insights from Complex Healthcare Datasets
News Archive
2025
2024
2023
2022
2021
2020

How Geographic Data Plays a Role in the Future of the Utilities Industry
There is a lot of change in the utilities industry. Increased demand for electricity, the need for cleaner energy, and an aging infrastructure are all factors coming together at the same time to force the industry to evolve.
Organizations are looking for clean energy solutions. A couple of possibilities that have been talked about for a long time are now closer to reality, and geographic data is going to play a key role in how to find them. Let’s take a look.

How Data Can Improve the Flow of Inventory
Organizations are constantly taking steps to make sure their supply chains are running as efficiently as possible. There are all kinds of possible adjustments, both visible and invisible to the outside world. Sometimes it’s a business relationship overseas, and sometimes it’s a new building that pops up in your city.
Those buildings can help organizations make a difference when it comes to inventory. There are different approaches companies can take, but inventory offers one area in which organizations can make a significant impact on the way they move products through the supply chain. In order for that to happen, they need to use data. Two companies made recent changes in this area. Let’s take a look at their decisions and how data plays a role in that work.