

How Dimensional Insight Analytics Is Used to Help Combat the Opioid Epidemic
How Dimensional Insight Analytics Is Used to Help Combat the Opioid Epidemic
What you’ll learn
This white paper demonstrates how Dimensional Insight’s analytics platform enables government agencies and healthcare providers to identify and address opioid misuse trends using real-time data.
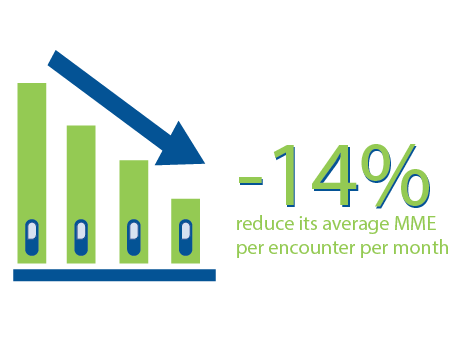
By calculating morphine milligram equivalents (MMEs) across millions of prescriptions, healthcare organizations can pinpoint high-risk prescribers, monitor Schedule II opioids, and assess patient risk levels. Hospitals use these insights to reduce average MME per encounter by 14%, while state agencies track prescribing behaviors by region to focus prevention efforts.
Backed by a columnar database architecture, Dimensional Insight’s platform processes vast datasets quickly and supports complex risk calculations. The result: a scalable, data-driven foundation that empowers healthcare executives to make informed policy, clinical, and community interventions in the fight against opioid misuse.
Introduction
The statistics are alarming. According to the Centers for Disease Control and Prevention, since 1999, the number of drug overdose deaths involving opioids has increased five-fold. More than 130 Americans die every day from opioid use. The numbers indicate a growing problem. But what if numbers could also provide the solution?
Dimensional Insight’s analytics platform can enable government agencies and healthcare providers to identify trends in the data and make a difference in the battle against the opioid epidemic. Let’s examine how.
Moving from trends to intervention
At the most basic level, an analytics solution can help organizations — from hospitals to health departments — look at trends in opioid use. That means that users can examine whether opioid use has increased over several quarters or several years. That information can be broken down by patient, by provider, or by dispenser. A more advanced analytics solution, such as Dimensional Insight’s platform, can help users go deeper into the numbers and manipulate the data in ways that can enable interventions instead of just looking at trends.
Most states have some kind of prescription drug monitoring program, but the prescriptions they monitor can vary. If a state is monitoring Schedules II through V, covering all thoroughly controlled substances, it could be dealing with tens of thousands of records per day, and millions of records per year. A key data point is Schedule II opioids, considered to be at the highest risk for misuse or abuse. These include drugs such as opium, morphine, codeine, oxycodone, and fentanyl.
Measuring morphine milligram equivalents
One way to assess risk of misuse or abuse, or even death, is to calculate the average daily MME of drugs and see which patients exceed certain MME thresholds. MME stands for morphine milligram equivalents and it is the standardized measurement used across all opioids, since they are not the same in terms of their strength. This provides a standard that prescribers are easily able to understand instead of having to calculate the potency of specific drugs. According to the CDC, patients who are prescribed more than 50 MME per day increase their risk of overdose by at least two times the risk of those prescribed fewer than 20 MME per day.
Calculating the average daily MME, though, when dealing with tens of thousands of records a day, can be complex. Dimensional Insight’s analytics platform can take the millions of opioid prescriptions generated and convert the units to the average daily MMEs per day per patient. And if a certain drug product alters the MME for any reason, Dimensional Insight will allow the user to change the formula with exclusion criteria.
How can we use this data?
Opioid data can be examined at the state, hospital, and provider levels in order to enact change. Here’s how users at all three levels have used Dimensional Insight analytics.

State level
Some state organizations have used analytics to see the volume of opioids that pharmacies are dispensing. They also look at the volume of opioids that healthcare providers prescribe. This enables them to spot prescribers whose volume might be far above the rest, or whose volume might not correlate with what is in line with his or her specialty. State agencies are also able to look at the data by municipality. This is helpful in terms of identifying areas in the state where there might be a larger opioid problem. Various agencies and healthcare providers can then work in tandem to provide more geographically focused programs in that area.
Hospital level
Hospitals use Dimensional Insight to examine the prescribing patterns of their physicians. They can examine which providers or specialties are prescribing the most opiates. They can also track metrics such as the average MME per encounter per month. For example, EvergreenHealth in the Seattle area was able to reduce its average MME per encounter per month by 14% due to the insights that a careful examination of the data provided.
Provider/prescriber level
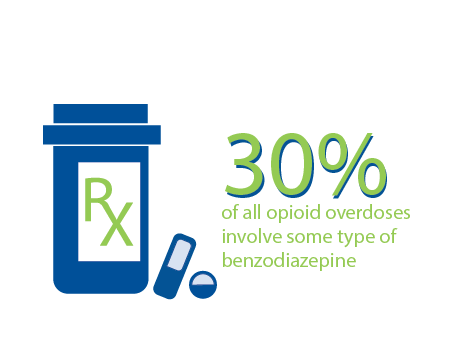
Healthcare professionals can use Dimensional Insight to monitor their own prescribing patterns, and compare them to those of their peers. They can also look up whether other providers prescribed benzodiazepines (sedatives such as Valium, Xanax, and Klonopin) to patients. These drugs, when combined with opioids, lead to a higher risk of overdose. In fact, the National Institutes of Health say that 30% of all opioid overdoses involve some type of benzodiazepine.
Strong technology infrastructure required
Of course, when you’re talking about tens of thousands of data points every day — equating to millions per year — you need a strong technology infrastructure to support all of this. Dimensional Insight’s technology is ideal for this type of analysis because its columnar database technology processes the data quickly — in just a fraction of the time of row-based queries — and provides fast access to various manipulations of the information. It can also handle more complex calculations. For example, there are various ways of calculating MMEs, from simple (weighted average) to more complex (accounting for overlapping days), and Dimensional Insight performs both types with ease.
Organizations that have successfully implemented Dimensional Insight technology to help combat the opioid epidemic are already seeing positive results from their efforts. For example, one state agency that is a Dimensional Insight customer has been able to reduce the number of Schedule II prescriptions in its state by 17% since 2013. However, there is still a lot of work that needs to be done. Analytics can help provide the right insight into trends and concerning data, but it’s up to everyone— government agencies, healthcare providers, pharmacies, patients, community services — to come together to take action to combat this growing and deadly crisis.