About Box Plot Indicators
A box plot indicator shows the distribution of data and can be used to compare multiple groups of numeric data through their quartiles.
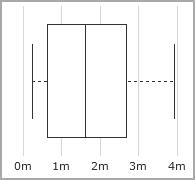
The box represents the second and third quartiles. A line inside the box shows the median. Whiskers are drawn from the 25th percentile to the minimum value and from the 75th percentile to the maximum value, thus showing the first and fourth quartiles.
See also:
- Adding an Indicator Portlet to a Page
- Indicator Portlet Options
- About Indicator Thresholds
- About Box Plot Charts