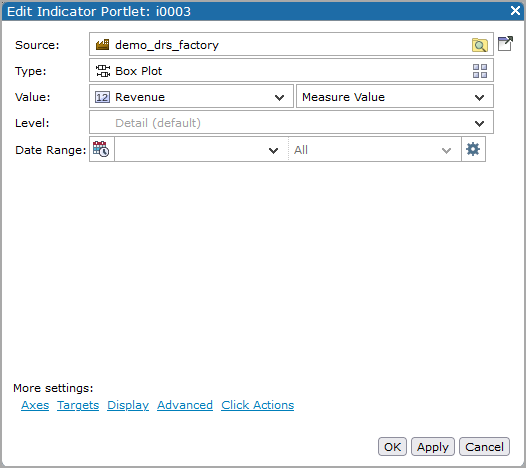
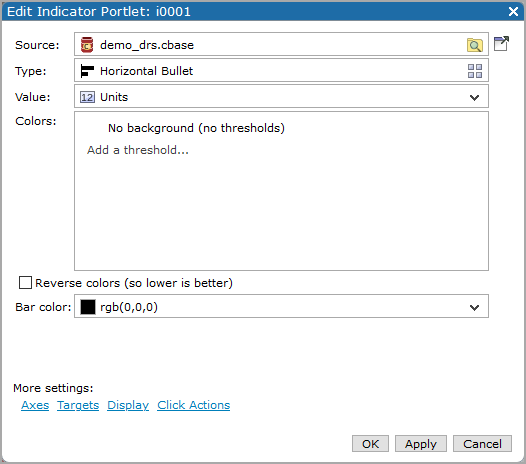
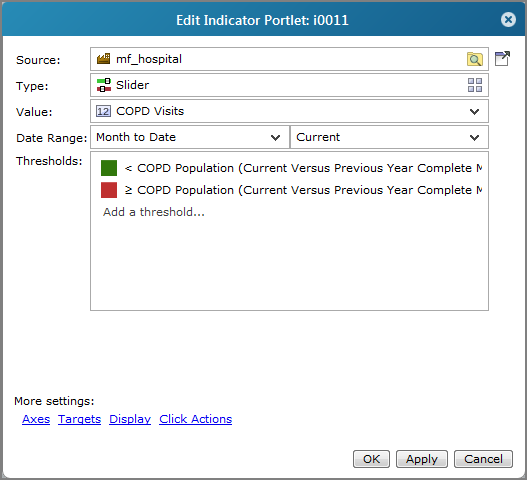
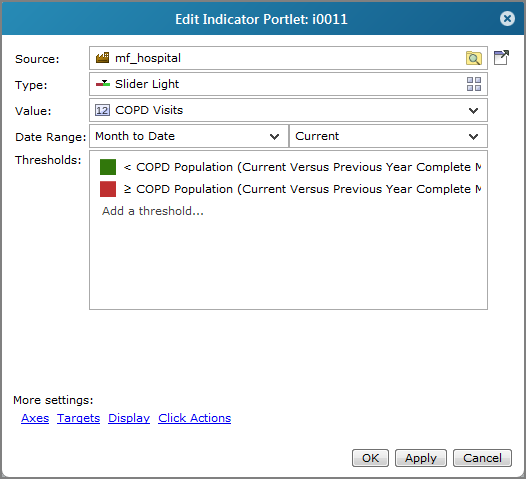
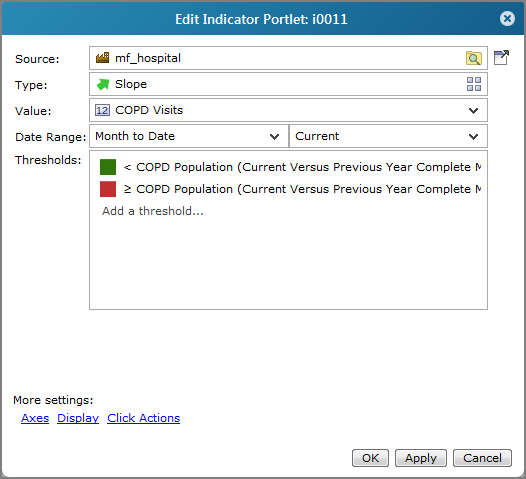
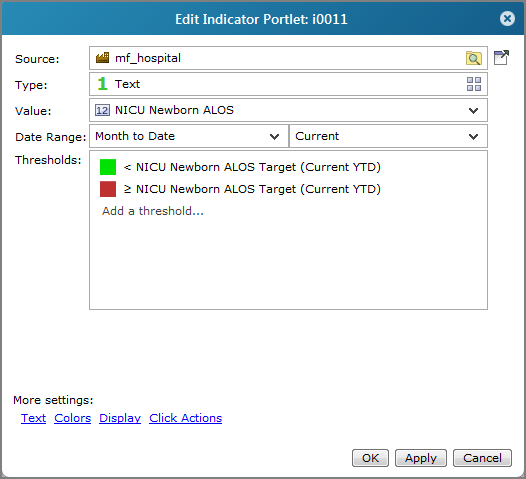
Indicator Portlet Options
Indicator portlet options vary, depending on the indicator type and your software license.
Individual indicator types have unique properties, but the following options are common to all types:
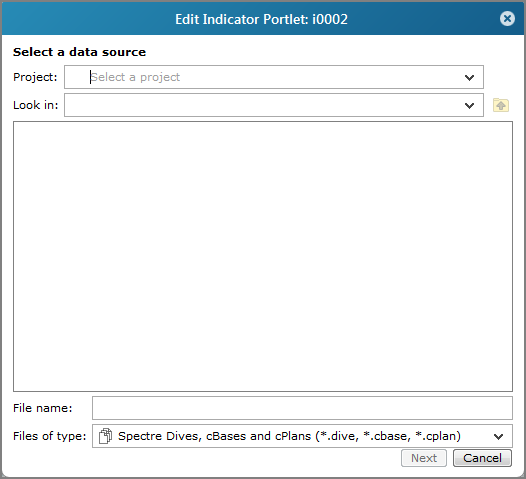
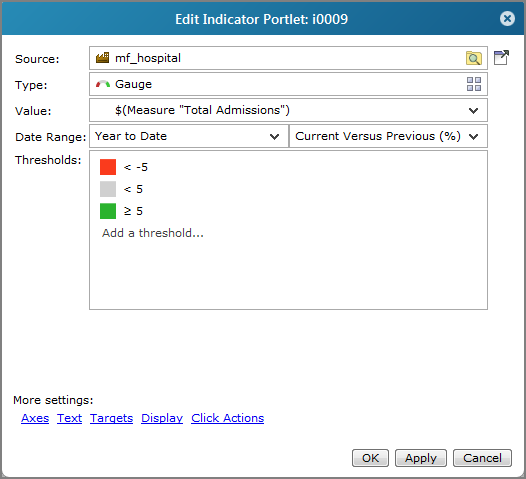
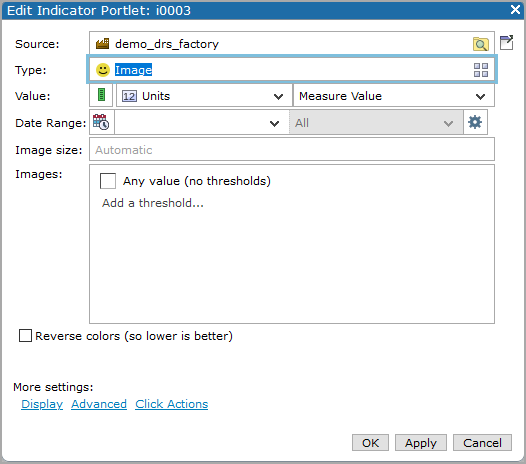
![]() Data source: Select a
Data source: Select a
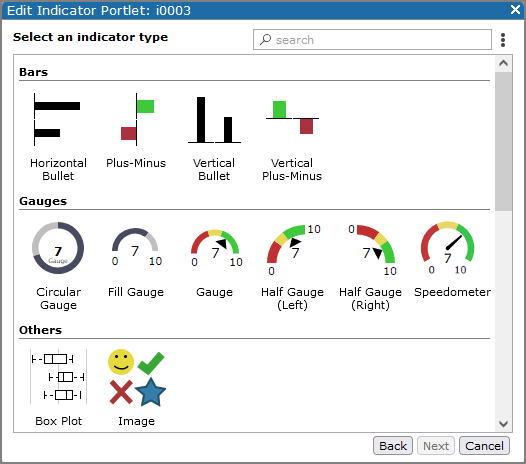
![]() Indicator type: Select the type of indicator that you want to use.
Indicator type: Select the type of indicator that you want to use.
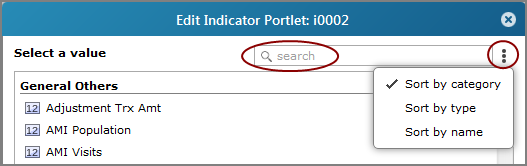
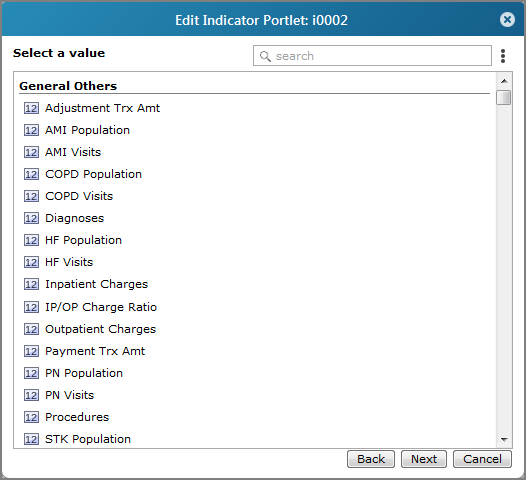
![]() Value: Select the Measure Factory value that you want to use.
Value: Select the Measure Factory value that you want to use.
TIP: You can click the menu ![]() icon for options to sort the list or use the search box to locate a value.
icon for options to sort the list or use the search box to locate a value.
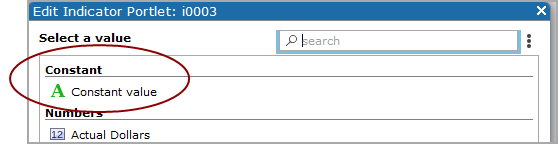
![]() constant value, which displays in every row.
constant value, which displays in every row.
CAUTION: Using $( ROW_DATA) or $( ROW_STRING) macros in a constant column can result in unexpected formatting. DI recommends that you use column values instead.
Auxiliary Measure Value: Select a baseline or goal value that is defined in the measure factory.
![]() Date Range: Select a date range from the list.
Date Range: Select a date range from the list.
![]() Period: Select a time period from the list.
Period: Select a time period from the list.
![]() Time series settings: Click the gear icon to the right of the Date Range to access additional time series options.
Time series settings: Click the gear icon to the right of the Date Range to access additional time series options.
![]() Thresholds/Colors/Images: Click Add a Threshold to specify threshold settings, including a threshold value, and depending on the indicator type, threshold range color or image, and if available, time range and period.
Thresholds/Colors/Images: Click Add a Threshold to specify threshold settings, including a threshold value, and depending on the indicator type, threshold range color or image, and if available, time range and period.
TIP: You can set the Threshold to be a summary column, constant value, or macro that resolves to a numeric value.
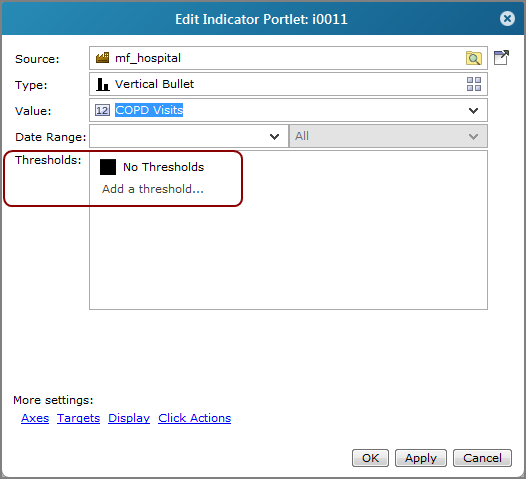
For more information, see About Indicator Thresholds.
Click the gear icon to right of the Time Range to access the ![]() Advanced time series option.
Advanced time series option.
Reverse colors (so lower is better) Select if you are measuring data whose goal is to be less than the threshold value. For example, if default threshold colors are used, values that are lower than the threshold are green, and values that are higher than the threshold are red.
![]() file type as a data source for indicator portlets.
file type as a data source for indicator portlets.
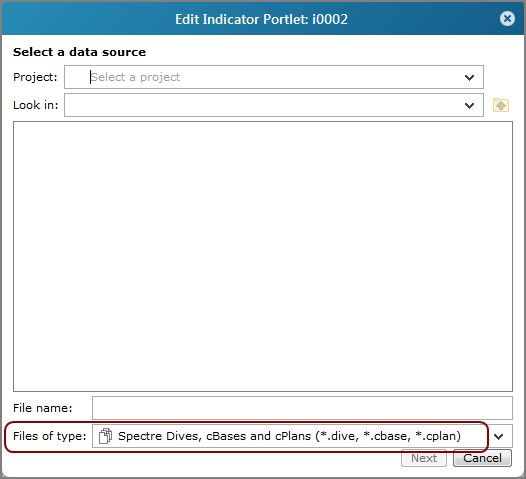
To override this behavior for a DivePort instance and allow marker and DiveBook files to be used, you can set the ignore-measure-factory-license portal info setting to true in the portaldb.json file. This setting prevents DivePort from filtering markers and DiveBook file types from the Edit Indicator Portlet dialog box.
NOTE: This is a portal-wide setting that allows you to use the Measure Factory licensed-DiveLine with a portal that is not limited by measure factory restraints. You can use DI Bridge to seamlessly switch access between the Measure Factory portal and the non-measure factory portal.
The following sections describe the specific options for each indicator type.
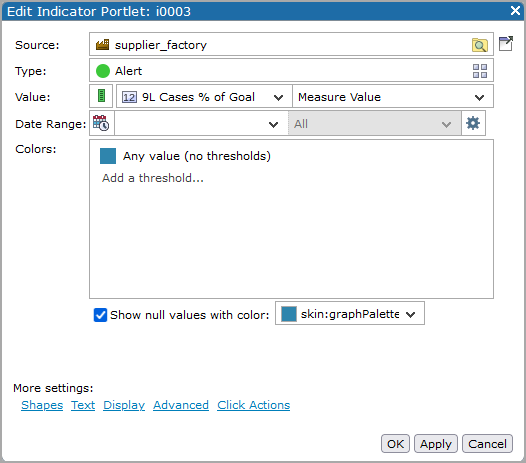
Show null values with color displays null values as an indicator in the specified color. If this option is not selected, null values are not shown.
NOTE: The default value for the color picker is the color that corresponds to a value of 0, based on the specified thresholds. If the color preference for 0 cannot be determined, as is the case if the thresholds are based on macros, the default value is the last color in the colors list.
| Option | Description |
|---|---|
| Shape |
Specifies how the alert appears. Options are Circle, Square, and Triangle. The color is determined by thresholds. Triangles point down when the value being graphed is at or below the low threshold, point up when the value is at or above the high threshold, and are replaced with circles or blank space when the value is in the middle range. |
| Maximum size |
NOTE: This option is available for indicator portlets only. It is not available for indicator columns in other types of portlets. |
| Option | Description |
|---|---|
| Placement | Specifies the placement of the value relative to the alert shape. The default is None, which does not display the value. Other options are Center, which overlaps the alert image, Left, and Right. |
| Value Font | Available when the Placement setting is not None. Specifies the font, size, and style of the value text. |
| Justification | Specifies the horizontal placement of the alert shape within the portlet. The default is Center. Other options are Right and Left. |
| Format | Available when the Placement setting is not None. Defines the format of the numeric Value. For more information, see Formatting Numeric Values. |
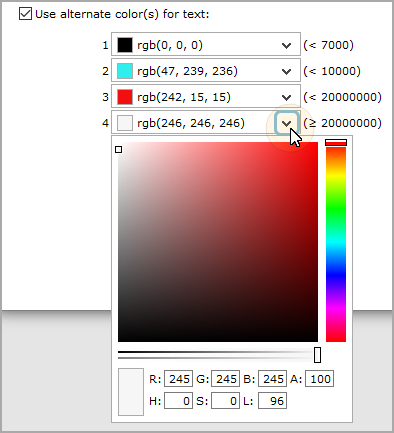
| Use alternate color(s) for text |
Available when the Placement setting is not None. Enables |
| Option | Description |
|---|---|
| Title Text | Specifies a title for the alert or the column heading if the alert is a portlet column. You can use DivePort macros for the title. |
| Font | Opens the font dialog box, in which you can choose the font and size of the alert title. The default is Verdana 16.0px bold. |
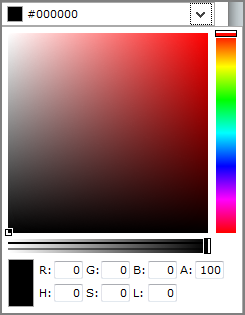
| Color |
Specifies the color of the title text. If you know the hexadecimal color code or RGB value, you can enter it in the Color box; or you can click the drop-down arrow to open the |
| Subtitle Text | Specifies a subtitle for the alert. You can use DivePort macros for the subtitle. |
| Font | Opens the font dialog box, in which you can choose the font and size of the alert subtitle. The default is Verdana 12px bold. |
| Color |
Specifies the color of the title text. If you know the hexadecimal color code or RGB value, you can enter it in the Color box; or you can click the drop-down arrow to open the |
| Filter | Specifies a measure or Spectre calc that is used to filter the data that displays. |
See also Editing Color Properties in a Portlet.
Level: Specifies a subdivision for the Value column data.
| Option | Description |
|---|---|
| Hide axes |
Suppresses the scale from being drawn on the outside of the indicator. This check box is cleared by default. NOTE: When a horizontal indicator is used in a column, space limitations require that the baseline is the only value that is labeled on the axis. Showing the baseline value and not the data value can confuse users. |
| Always include zero |
Available when the Scale Minimum is set to Automatic. Ensures that the scale includes 0. NOTE: Under certain conditions, such as when the scale minimum or maximum value is set to 0, this option is set automatically and cannot be changed. |
| Scale Minimum |
Defines the starting point of the scale. The default, Automatic, uses the source data to determine the value. You can also enter a value manually. NOTE: This option accepts macros. |
| Scale Maximum |
Defines the end point of the scale. The default, Automatic, uses the source data to determine the value. You can also enter a value manually. NOTE: This option accepts macros. |
| Scale Format | Defines the scale format. For more information, see Formatting Numeric Values. |
| Scale Font | Specifies the font, size, and style of the scale text. |
| Option | Description |
|---|---|
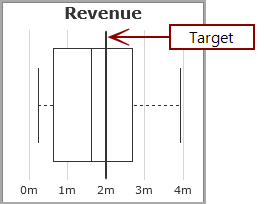
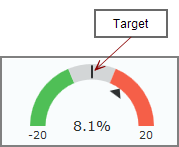
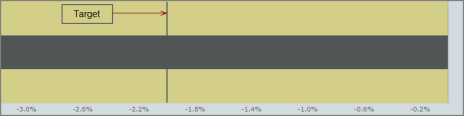
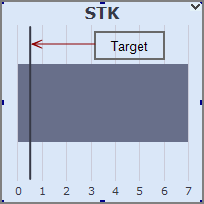
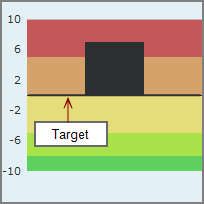
| Target |
Specifies a target value, which displays as a |
| Date Range | Specifies a date range for the target. |
| Period (not labeled) | Specifies a time period for the target. |
|
|
Time series settings: Click the gear icon to the right of the Date Range to access additional time series options. |
| Option | Description |
|---|---|
| Title Text | Specifies a title for the indicator or the column heading if the indicator is a portlet column. You can use DivePort macros for the title. |
| Title Font | Opens the font dialog box, in which you can choose the font and size of the title. The default is Verdana 16.0px bold. |
| Title Color (not labeled) | Specifies the color of the title text. If you know the hexadecimal color code or RGB value, you can enter it in the Color box; or you can click the drop-down arrow to open the color picker. The default is #000000 (black). |
| Subtitle Text | Specifies a subtitle for the indicator or the column heading if the indicator is a portlet column. You can use DivePort macros for the title. |
| Subtitle Font | Opens the font dialog box, in which you can choose the font and size of the title. The default is Verdana 16.0px bold. |
| Subtitle Color (not labeled) | Specifies the color of the subtitle text. If you know the hexadecimal color code or RGB value, you can enter it in the Color box; or you can click the drop-down arrow to open the color picker. The default is #000000 (black). |
| Filter | Specifies a measure or Spectre calculation that is used to filter the data that displays. |
| Option | Description |
|---|---|
| Parse string values as numeric |
Allows string columns to be used as numeric indicators as:
|
| Option | Description |
|---|---|
| Show threshold values |
Applies to gauge and half gauge (left or right) only. Displays the values of each threshold (space permitting) along the outside of the gauge. NOTE: In DivePort 7.1(15) and later, this option is replaced with the Scale display, Numbers option, Thresholds setting. |
| Scale Minimum |
Defines the starting point of the scale. The default, Automatic, uses the source data to determine the value. You can also enter a value manually. NOTE: This option accepts macros. |
| Scale Maximum |
Defines the end point of the scale. The default, Automatic, uses the source data to determine the value. You can also enter a value manually. NOTE: This option accepts macros. |
| Scale Format | Applies to fill gauge, gauge, half gauge, and speedometer. Defines the scale format. Select from options in the list or enter your own formatting. For more information, see Formatting Numeric Values. |
| Scale Font | Applies to fill gauge, gauge, half gauge, and speedometer. Specifies the font, size, and style of the scale text. |
| Scale display Applies to fill gauge, gauge, half gauge, and speedometer. | |
| Numbers |
Specifies what displays on the scale. The default is None, which omits all but the minimum and maximum scale values. Other options are:
|
| Include tick marks | Adds tick marks at even intervals to the outside of the gauge. |
| Position scale inside of gauge | Available when Numbers or Include tick marks is selected. Adds the scale labels or tick marks to the inside of the gauge instead of the outside. |
| Option | Description |
|---|---|
| Show value |
Specifies that the gauge is labeled with the specified data value. NOTE: The skin property portletIndicatorShowValue defines the default for this option. If you want the value to not appear by default, you must add portletIndicatorShowValue=false to the active skin file. |
| Value Font | Specifies the font, size, and style of the value text. |
| Value Font color | Opens a color picker that you can use to select a color for the text value. |
| Format | Defines the format of the numeric value. For more information, see Formatting Numeric Values. |
| Show value name |
Applies to circular gauges. Specifies that the gauge is labeled with the specified value name. NOTE: The skin property portletIndicatorShowValueName defines the default for this option. If you want the value to not appear by default, you must add portletIndicatorShowValueName=false to the active skin file. |
| Show measure name | Applies to circular gauges with Measure Factory. Specifies that the gauge is labeled with the specified measure name. |
| Option | Description |
|---|---|
| Target |
Specifies a target value, that displays as |
| Date Range | Specifies a date range for the target. |
| Period (not labeled) | Specifies a time period for the target. |
Applies to gauge, half gauge, and speedometer.
| Option | Description |
|---|---|
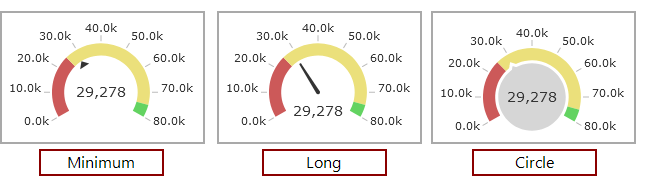
| Shape |
Specifies the length and shape of the needle. Options are Minimal, Long, and for speedometers only, Circle.
|
| Color needle according to thresholds | Specifies that the needle color reflects the threshold values. |
| Option | Description |
|---|---|
| Title Text | Specifies a title for the gauge or the column heading if the gauge is a portlet column. You can use DivePort macros for the title. |
| Font | Opens the font dialog box, in which you can choose the font and size of the gauge title. The default is Verdana 16.0px bold. |
| Color |
Specifies the color of the gauge title. If you know the hexadecimal color code or RGB value, you can enter it in the Color box; or you can click the drop-down arrow to open the |
| Subtitle Text | Specifies a subtitle title for the gauge. You can use DivePort macros for the title. |
| Font | Opens the font dialog box, in which you can choose the font and size of the gauge title. The default is Verdana 12px bold. |
| Color |
Specifies the color of the gauge title. If you know the hexadecimal color code or RGB value, you can enter it in the Color box; or you can click the drop-down arrow to open the color picker. The default is #000000 (black). |
| Filter | Specifies a measure or Spectre calculation that is used to filter the data that displays. |
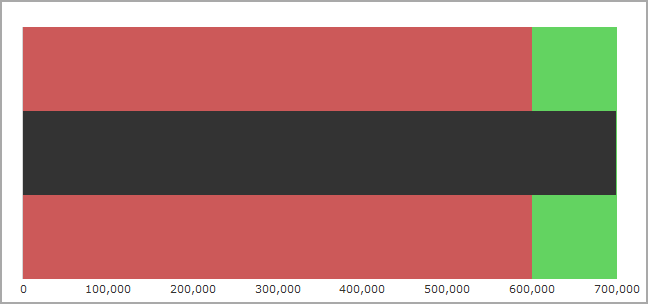
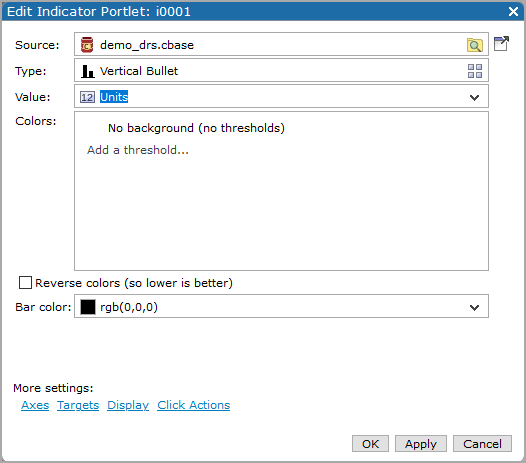
Bar color Specifies the color of the horizontal bullet. Default is black rgb(0,0,0)
NOTE: Threshold colors are applied to the indicator ![]() background.
background.
| Option | Description |
|---|---|
| Hide axes |
Suppresses the scale from being drawn on the outside of the bullet. This check box is cleared by default. NOTE: When a horizontal indicator is used in a column, space limitations require that the baseline is the only value that is labeled on the axis. Showing the baseline value and not the data value can confuse users. |
| Scale Minimum |
Defines the starting point of the scale. The default, Automatic, uses the source data to determine the value. You can also enter a value manually. NOTE: This option accepts macros. |
| Scale Maximum |
Defines the end point of the scale. The default, Automatic, uses the source data to determine the value. You can also enter a value manually. NOTE: This option accepts macros. |
| Scale Format | Defines the scale format. For more information, see Formatting Numeric Values. |
| Scale Font | Specifies the font, size, and style of the scale text. |
| Option | Description |
|---|---|
| Show value on bar | Displays the data value on the bar. Displays the data value on the bar, near the zero line if space allows. Negative values are rendered on the left side of the zero line, positive and zero values are rendered on the right side. If there is no room near the zero line, the value is rendered on the outside of the bar, near the bar's end. If there is no room anywhere, the value is not rendered. |
| Value Font | Available when Show value on bar is selected. Specifies the font, size, and style of the value text. |
| Value Font Color | Opens a color picker that you can use to specify a color for the value text that displays on the bar. |
| Format | Defines the format of the numeric Value. For more information, see Formatting Numeric Values. |
| Option | Description |
|---|---|
| Target |
Specifies a target value, that displays as |
| Date Range | Specifies a date range for the target. |
| Period (not labeled) | Specifies a time period for the target. |
| Option | Description |
|---|---|
| Title Text | Specifies a title for the bullet or the column heading if the bullet is a portlet column. You can use DivePort macros for the title. |
| Font | Opens the font dialog box, in which you can choose the font and size of the bullet title. The default is Verdana 16.0px bold. |
| Color |
Specifies the color of the title text. If you know the hexadecimal color code or RGB value, you can enter it in the Color box; or you can click the drop-down arrow to open the |
| Filter | Specifies a measure or Spectre calculation that is used to filter the data that displays. |
| Option | Description | ||||||||||
|---|---|---|---|---|---|---|---|---|---|---|---|
| Image size | Specifies the size of the image in pixels, in the format <width> x <height>. The default, Automatic scales the image to fit in the portlet box while maintaining the aspect ratio. | ||||||||||
| Images |
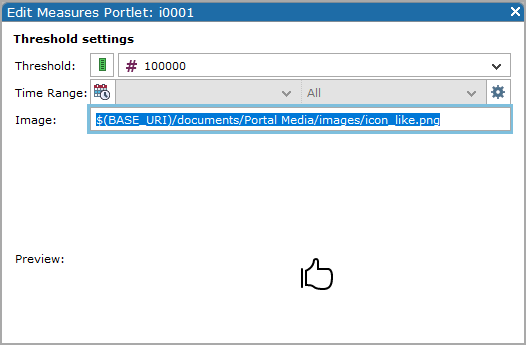
Click Add a Threshold to specify the threshold settings, including the web-accessable path to the image file.
TIP: You can set the Threshold to be a summary column, constant value, or macro that resolves to a numeric value. Click the gear icon to right of the Time Range to access the Advanced time series option.
Specify the image file path in the Image text box. NOTE: Typically images are stored in the DivePort image library: di/solution/webdata/<diveport>/doc-libraries/Portal Media/images/. The Image option accepts macros that define the path. For example: $(IMAGES_URI)/my-image.JPG where "my-image.JPG" is located under /customizations/images in the webdata folder $(BASE_URI)/documents/Portal Media/images/icon_like.png where "icon_like.png" is located in /doc-libraries/Portal Media/images |
| Option | Description |
|---|---|
| Title Text | Specifies a title for the image or the column heading if the image is a portlet column. You can use DivePort macros for the title. |
| Font | Opens the font dialog box, in which you can choose the font and size of the alert title. The default is Verdana 16.0px bold. |
| Color |
Specifies the color of the title text. If you know the hexadecimal color code or RGB value, you can enter it in the Color box; or you can click the drop-down arrow to open the |
| Filter | Specifies a measure or Spectre calculation that is used to filter the data that displays. |
| Option | Description |
|---|---|
| Parse string values as numeric | Allows string columns to be used as numeric indicators as:
If the cell content does not parse to a number, it appears as null. |
| Hide totals row | Available if the indicator is a portlet column |
| Option | Description |
|---|---|
| Hide axes |
Suppresses the scale from being drawn on the outside of the indicator. This check box is cleared by default. NOTE: When a horizontal indicator is used in a column, space limitations require that the baseline is the only value that is labeled on the axis. Showing the baseline value and not the data value can confuse users. |
| Scale Minimum |
Defines the starting point of the scale. The default, Automatic, uses the source data to determine the value. You can also enter a value manually. NOTE: This option accepts macros. |
| Scale Maximum |
Defines the end point of the scale. The default, Automatic, uses the source data to determine the value. You can also enter a value manually. NOTE: This option accepts macros. |
| Scale Format | Defines the scale format. For more information, see Formatting Numeric Values. |
| Scale Font | Applies to fill gauge, gauge, half gauge, and speedometer. Specifies the font, size, and style of the scale text. |
| Option | Description |
|---|---|
| Show value on bar | Displays the data value on the bar, near the zero line if space allows. Negative values are rendered on the left side of the zero line, positive and zero values are rendered on the right side. If there is no room near the zero line, the value is rendered on the outside of the bar, near the bar's end. If there is no room anywhere, the value is not rendered. |
| Value Font | Available when Show value on bar is selected. Specifies the font, size, and style of the value text. |
| Format | Defines the format of the numeric Value. For more information, see Formatting Numeric Values. |
| Option | Description |
|---|---|
| Target |
Specifies a target value, that displays as a |
| Date Range | Specifies a date range for the target. |
| Period (not labeled) | Specifies a time period for the target. |
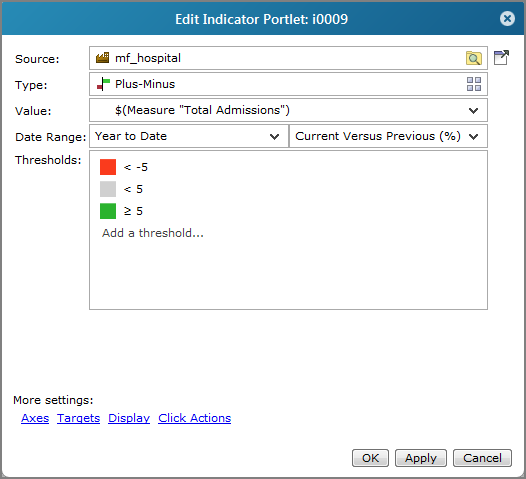
| Baseline |
Specifies the point on the x-axis that shows if the data values are above (plus) or below (minus) the baseline. The default is 0. |
| Option | Description |
|---|---|
| Title Text | Specifies a title for the plus-minus indicator or the column heading if the indicator is a portlet column. You can use DivePort macros for the title. |
| Font | Opens the font dialog box, in which you can choose the font and size of the title. The default is Verdana 16.0px bold. |
| Color |
Specifies the color of the title text. If you know the hexadecimal color code or RGB value, you can enter it in the Color box; or you can click the drop-down arrow to open the |
| Filter | Specifies a measure or Spectre calculation that is used to filter the data that displays. |
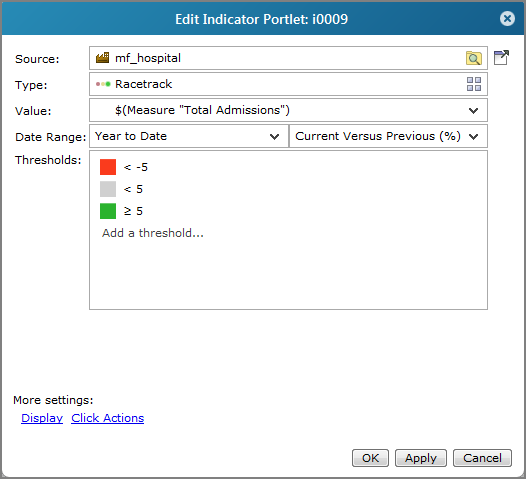
| Option | Description |
|---|---|
| Title Text | Specifies a title for the racetrack or the column heading if the indicator is a portlet column. You can use DivePort macros for the title. |
| Font | Opens the font dialog box, in which you can choose the font and size of the racetrack title. The default is Verdana 16.0px bold. |
| Color |
Specifies the color of the title text. If you know the hexadecimal color code or RGB value, you can enter it in the Color box; or you can click the drop-down arrow to open the |
| Filter | Specifies a measure or Spectre calculation that is used to filter the data that displays. |
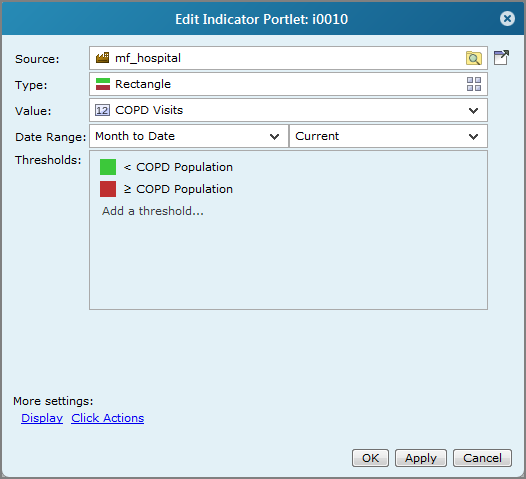
| Option | Description |
|---|---|
| Title Text | Specifies a title for the rectangle indicator or the column heading if the indicator is a portlet column. You can use DivePort macros for the title. |
| Font | Opens the font dialog box, in which you can choose the font and size of the title. The default is Verdana 16.0px bold. |
| Color |
Specifies the color of the title text. If you know the hexadecimal color code or RGB value, you can enter it in the Color box; or you can click the drop-down arrow to open the |
| Filter | Specifies a measure or Spectre calculation that is used to filter the data that displays. |
| Option | Description |
|---|---|
| Use migrated gradient coloring |
|
TIP: If you are using a slider indicator as a column in a measures portlet, the data value might not appear in the slider data box if the column height is too small to accommodate the label. If this occurs, increase the Default Item Height in the Measure Portlet > Miscellaneous settings dialog box.
| Option | Description |
|---|---|
| Hide axes |
Suppresses the scale from being drawn on the outside of the indicator. This check box is cleared by default. NOTE: When a horizontal indicator is used in a column, space limitations require that the baseline is the only value that is labeled on the axis. Showing the baseline value and not the data value can confuse users. |
| Scale Minimum |
Specifies the low end of the slider scale. The default, Automatic, uses the source data to determine the value. Alternatively, you can enter a numeric value. NOTE: This option accepts macros. |
| Scale Maximum |
Specifies the high end of the slider scale. The default, Automatic, uses the Factory measure data to determine the value. Alternatively, you can enter a numeric value. NOTE: This option accepts macros. |
| Scale Format | Defines the scale format. For more information, see Formatting Numeric Values. |
| Scale Font | Specifies the font, size, and style of the scale text. |
| Option | Description |
|---|---|
| Value Font | Specifies the font, size, and style of the value text. |
| Value Font Color | Opens a color picker that you can use to specify a color for the value text. |
| Format | Defines the format of the numeric Value. For more information, see Formatting Numeric Values. |
| Option | Description |
|---|---|
| Target |
Specifies a target value that displays as a vertical line on the slider indicator. This can be a number or a macro. |
| Date Range | Specifies a date range for the target. |
| Period (not labeled) | Specifies a time period for the target. |
| Option | Description |
|---|---|
| Title Text | Specifies a title for the slider indicator or the column heading if the indicator is a portlet column. You can use DivePort macros for the title. |
| Font | Opens the font dialog box, in which you can choose the font and size of the title. The default is Verdana 16.0px bold. |
| Color |
Specifies the color of the title text. If you know the hexadecimal color code or RGB value, you can enter it in the Color box; or you can click the drop-down arrow to open the |
| Filter | Specifies a measure or Spectre calculation that is used to filter the data that displays. |
| Option | Description |
|---|---|
| Hide axes |
Suppresses the scale from being drawn on the outside of the indicator. This check box is cleared by default. NOTE: When a horizontal indicator is used in a column, space limitations require that the baseline is the only value that is labeled on the axis. Showing the baseline value and not the data value can confuse users. |
| Scale Minimum |
Specifies the low end of the slider scale. The default, Automatic, uses the source data to determine the value. Alternatively, you can enter a numeric value. NOTE: This option accepts macros. |
| Scale Maximum |
Specifies the high end of the slider scale. The default, Automatic, uses the source data to determine the value. Alternatively, you can enter a numeric value. NOTE: This option accepts macros. |
| Scale Format | Defines the scale format. For more information, see Formatting Numeric Values. |
| Scale Font | Specifies the font, size, and style of the scale text. |
| Option | Description |
|---|---|
| Target |
Specifies a target value, that displays as a vertical line on the slider indicator. This can be a number or a macro. |
| Date Range | Specifies a date range for the target. |
| Period (not labeled) | Specifies a time period for the target. |
| Option | Description |
|---|---|
| Title Text | Specifies a title for the slider or the column heading if the indicator is a portlet column. You can use DivePort macros for the title. |
| Font | Opens the font dialog box, in which you can choose the font and size of the title. The default is Verdana 16.0px bold. |
| Color |
Specifies the color of the title text. If you know the hexadecimal color code or RGB value, you can enter it in the Color box; or you can click the drop-down arrow to open the |
| Filter | Specifies a measure or Spectre calculation that is used to filter the data that displays. |
| Option | Description |
|---|---|
| Scale Minimum |
Defines the minimum value of the scale. The default, Automatic, uses source data to determine the value. You can also enter a value manually. If the data equals this value, the slope arrow points straight down. NOTE: This option accepts macros. |
| Scale Maximum |
Defines the maximum value of the scale. The default, Automatic, uses the source data to determine the value. You can also enter a value manually. If the data equals this value, the slope arrow points straight up. NOTE: This option accepts macros. |
| Scale Format | Defines the scale format. For more information, see Formatting Numeric Values. |
NOTES:
-
If only one limit value is set, an automatic scale is generated.
-
If the scale minimum or maximum setting contains a macro that evaluates to an empty string or non-numeric value, an automatic scale is generated.
-
In matrix portlets, the scale limits are determined on a per-row basis.
-
In measures portlets, if the scale axes settings contain a row-level macro, the scale limits are determined on a per-row basis. Otherwise, the scale limits are the same for every row in the column.
| Option | Description |
|---|---|
| Title Text | Specifies a title for the slope indicator or the column heading if the indicator is a portlet column. You can use DivePort macros for the title. |
| Font | Opens the font dialog box, in which you can choose the font and size of the title. The default is Verdana 16.0px bold. |
| Color |
Specifies the color of the title text. If you know the hexadecimal color code or RGB value, you can enter it in the Color box; or you can click the drop-down arrow to open the |
| Filter | Specifies a measure or Spectre calculation that is used to filter the data that displays. |
| Option | Description |
|---|---|
| Font | Specifies the font, style, and size of the text indicator. The default is Auto. |
| Justification | Specifies the text horizontal alignment in the portlet. The default is Automatic. Other options are Right, Left, and Center. |
| Format | Defines the text format. For more information, see Formatting Numeric Values. The default is Automatic. |
| Option | Description |
|---|---|
| Color column | Used with thresholds. Specifies a measure column to use for exception coloring. |
| Color background instead of text | Specifies that the threshold colors fill in the cell or portlet background instead of the coloring the text. By default, the text color is black or white, depending upon the brightness of the background color. |
| Keep text color fixed | Available when Color background instead of text is selected. Enables a color picker that you can use to specify a text color other that black or white. |
| Option | Description |
|---|---|
| Parse string values as numeric |
Allows string columns to be used as numeric indicators as:
If the cell content does not parse to a number, it appears as null. |
| Option | Description |
|---|---|
| Title Text | Specifies a title for the text indicator or the column heading if the indicator is a portlet column. You can use DivePort macros for the title. |
| Font | Opens the font dialog box, in which you can choose the font and size of the title. The default is Verdana 16.0px bold. |
| Color |
Specifies the color of the title text. If you know the hexadecimal color code or RGB value, you can enter it in the Color box; or you can click the drop-down arrow to open the |
| Filter | Specifies a measure or Spectre calculation that is used to filter the data that displays. |
Bar color Specifies the color of the vertical bullet bar. Default is black rgb(0,0,0)
NOTE: Threshold colors are applied to the indicator background.
| Option | Description |
|---|---|
| Hide axes |
Suppresses the scale from being drawn on the outside of the bullet. This check box is cleared by default. NOTE: When a horizontal indicator is used in a column, space limitations require that the baseline is the only value that is labeled on the axis. Showing the baseline value and not the data value can confuse users. |
| Scale Minimum |
Defines the starting point of the scale. The default, Automatic, uses the source data to determine the value. You can also enter a value manually. NOTE: This option accepts macros. |
| Scale Maximum |
Defines the end point of the scale. The default, Automatic, uses the source data to determine the value. You can also enter a value manually. NOTE: This option accepts macros. |
| Scale Font | Specifies the font, size, and style of the scale text. |
| Option | Description |
|---|---|
| Target |
Specifies a target value, that displays as a |
| Date Range | Specifies a date range for the target. |
| Period (not labeled) | Specifies a time period for the target. |
| Option | Description |
|---|---|
| Title Text | Specifies a title for the vertical bullet or the column heading if the indicator is a portlet column. You can use DivePort macros for the title. |
| Font | Opens the font dialog box, in which you can choose the font and size of the title. The default is Verdana 16.0px bold. |
| Color |
Specifies the color of the title text. If you know the hexadecimal color code or RGB value, you can enter it in the Color box; or you can click the drop-down arrow to open the |
| Filter | Specifies a measure or Spectre calculation that is used to filter the data that displays. |
| Option | Description |
|---|---|
| Title Text | Specifies a title for the vertical racetrack or the column heading if the indicator is a portlet column. You can use DivePort macros for the title. |
| Font | Opens the font dialog box, in which you can choose the font and size of the title. The default is Verdana 16.0px bold. |
| Color |
Specifies the color of the title text. If you know the hexadecimal color code or RGB value, you can enter it in the Color box; or you can click the drop-down arrow to open the |
| Filter | Specifies a measure or Spectre calculation that is used to filter the data that displays. |
See also: