About Indicator Thresholds
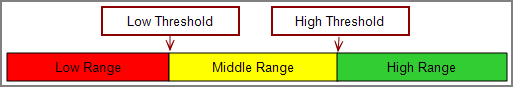
DivePort uses these threshold settings to divide the indicator into ranges. Typically, there are two threshold levels and three ranges. ![]() Example
Example
![]() Example
Example

When creating indicators that use threshold settings, you must specify at least one threshold either manually or by identifying a data source or macro. A data value is compared to the thresholds, and the indicator is drawn accordingly.
-
If you set only one threshold: By default, the indicator for values less than the threshold are red, and values greater than or equal to the threshold are green. For example if you set a single value of 10, the indicators for values < 10 are red, and values ≥ 10 are green.

-
If you set two thresholds: By default, the indicator for values less than the lowest threshold are red, mid-range values are yellow, and values greater than or equal to the highest threshold are green.

-
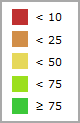
If you set more than two thresholds: By default, the indicator for values less than the lowest threshold are red, values greater than or equal to the highest threshold are green, and mid-range values are assigned colors in between.
-
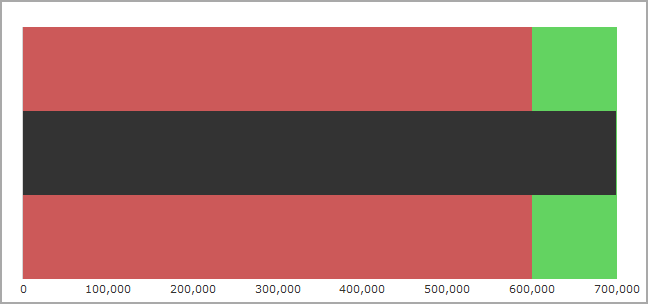
On horizontal bullet indicators and vertical bullet indicators, threshold colors are applied to the indicator background.
The default colors assume that a higher number is considered good, and lower numbers are bad. However, if you are measuring data whose goal is less than the threshold value, and numbers higher than the threshold are not wanted, you can select the Reverse colors option on the indicator column setting dialog box. Additionally, you can customize indicator colors on the threshold settings page.
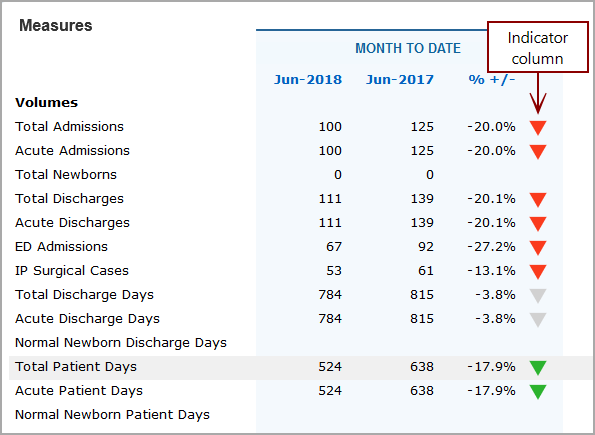
NOTE: If the data value is null, the indicator column for that value renders blank
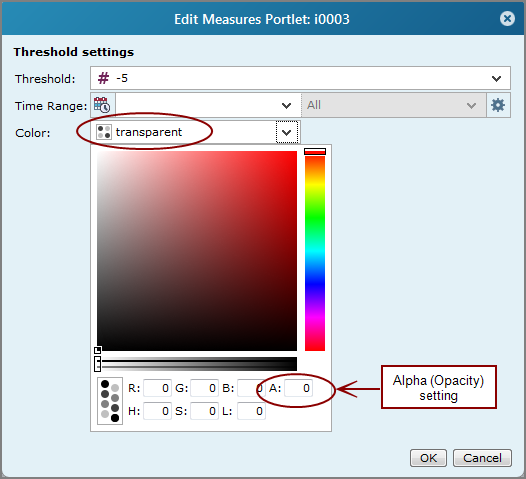
TIP: If you want to show only low- and high-range indicators (do not show mid-range indicators) on a two-level threshold range, you can set the mid-range color to be transparent.
On the Threshold settings ![]() dialog box, set the mid-range threshold color opacity to 0.
dialog box, set the mid-range threshold color opacity to 0.
See also About the Color Pickers.
Axes Scale Range
By default, DivePort uses the source data to determine the high and low values of the axes scale. However, in the Axes Settings dialog box, you can specify Scale Minimum and Scale Maximum values to provide a consistent view.
See also: