You can use exception coloring to highlight trends or data values that are above or below a given threshold in tabular displays and reports. Color can be applied to text or graphic indicators.
-
On the tabular display, select Data > Edit Columns.
The Edit Columns dialog box opens.
-
Select the column to which you want to apply exception coloring, and then click Edit.
The Edit Column dialog box opens.
- Select the Options tab.
- Under Exception Column, select Self.
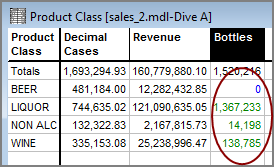
ProDiver colors the numeric data as follows: Positive numbers appear green, negative numbers appear red, and zeroes appear blue. ![]() Example.
Example.
If you generate a report from the tabular, the report displays the data in these colors.
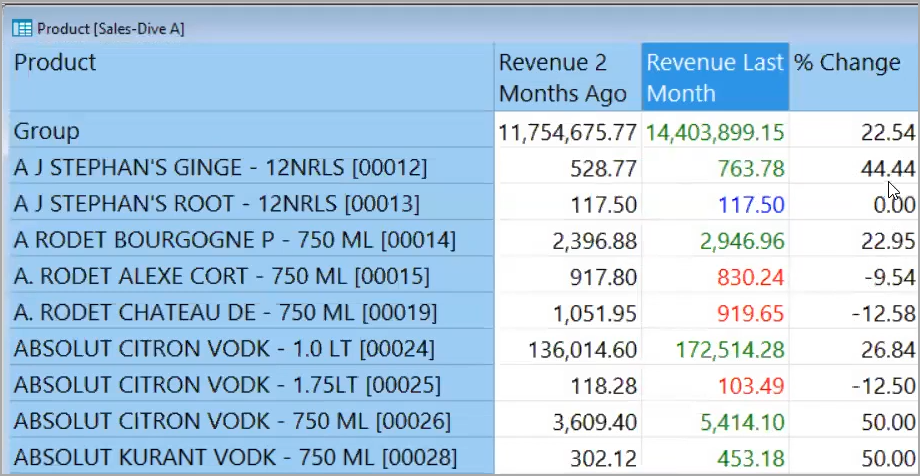
Alternatively, you can color the data based on the values in a different column. Under Exception Column, select Other Column, and then specify the column that you want to use to determine the colors. In the following example, exception colors are applied to the
Revenue Last Month column, based on the values in the % Change column.
-
If the % Change value is < 0, the value for Revenue Last Month on that row is colored red.
-
If the % Change value = 0, the value for Revenue Last Month on that row is colored blue.
-
If the % Change value is > 0, the value for Revenue Last Month on that row is colored green.
If you create a report from a tabular view with exception coloring, the colors are carried over to the report.
Alternatively, on an unlocked report, you can right-click the column data and select Edit Item, click the Exception ![]() tab and define exception values and indicators to add to the report.
tab and define exception values and indicators to add to the report.
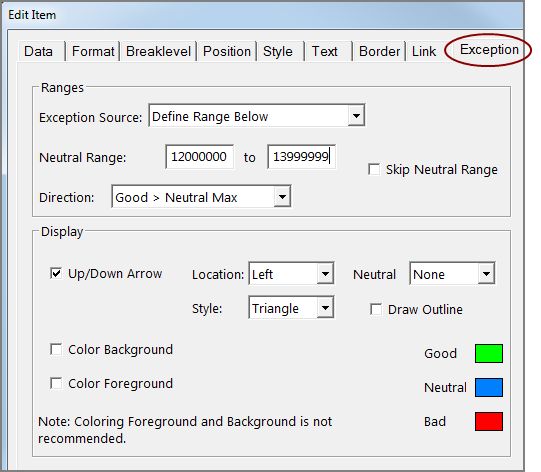
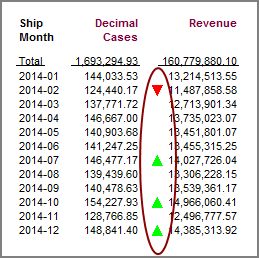
In this Revenue column ![]() example, the Neutral Range is defined as 12,000,000 to 13,999,999, and the display instructions are to display an Up/Down Arrow in a Triangle style to mark the revenue data that is above or below the neutral range.
example, the Neutral Range is defined as 12,000,000 to 13,999,999, and the display instructions are to display an Up/Down Arrow in a Triangle style to mark the revenue data that is above or below the neutral range.
See also