Chart Portlet Options
Available chart portlet options depend on:
- Type of chart
- Type of data
- License
- Software version
The following table describes options that apply to all types of chart portlets.
| Option | Description |
|---|---|
| Project | Specifies the project that provides the data for the portlet. |
| Look in | Applies to Standard License. Specifies the folder location of the cPlan, cBase, marker or Spectre Dive file that you want to use as a data source. |
| File name | Applies to Standard License. Specifies the cPlan, cBase, marker, or Spectre Dive file that you want to use as a data source. |
| Files of type | Applies to Standard License. Specifies the type of file that you want to use as a data source. This option helps you find the appropriate file in a large database by filtering out other types of files. |
| Source |
Specifies the data source. Either the file name (standard license) or the project name (Measure Factory license). |
|
|
Opens the Select a data source dialog box, which you can use to select a different data source file. |
|
|
Provides options to open the source file in another application, typically ProDiver, NetDiver, or Workbench.
|
| Chart type | Specifies the type of chart. You can use the search box to narrow the list of choices, or click the menu icon  to sort the list or switch to list view. For more information, including descriptions and examples of chart types, see Charts. to sort the list or switch to list view. For more information, including descriptions and examples of chart types, see Charts. |

|
Opens the Select a chart type page, which you can use to change the chart type. |
| Dimension |
Specifies the dimension that is used to enumerate values on the chart. NOTES:
|
| Values |
Specifies measure or summary data values that display on the chart. NOTE: Some charts support more than one value. |
The following sections define options available to the specified chart types.
Area, Spline Area, and Stacked Area Charts
In addition to the options that apply to all chart types, the following options apply to area, spline area, and stacked area charts.
Additional values, with customizable Value settings. To add a value, click Add a value on the main page.
| Option | Description | ||||||
|---|---|---|---|---|---|---|---|
| Column | Specifies a measure or summary value to use as a column. | ||||||
| Measure Value | Applies to Measure Factory. Specifies whether to use the measure value or |
||||||
|
|
Opens the time series mode settings box. Options are Basic |
||||||
| Basic time series settings |
Basic features are as follows:
|
||||||
|
Advanced time series settings |
Advanced features allow the following customization of the time period:
|
||||||
|
Comparison time series settings |
|
||||||
| Label | Specifies a label for the value column. The column name is the default label. This option accepts portlet-level macros. | ||||||
| Color | Specifies the color of the data value. | ||||||
| Axis | Specifies the location of the Axis scale. Depending on the chart type, the default is Left or Bottom. Other options are Right or Top. |
MultiTab Area, MultiTab Spline Area, and MultiTab Stacked Area Charts
In addition to the options that apply to all chart types, the following options apply to MultiTab area charts.
| Option | Description | ||||||
|---|---|---|---|---|---|---|---|
| Category |
Specifies a secondary dimension that is used in MultiTab charts to divide the first dimension's data into categories. |
||||||
|
|
Opens the time series mode settings box. Options are Basic |
||||||
| Basic time series settings |
Basic features are as follows:
|
||||||
|
Advanced time series settings |
Advanced features allow the following customization of the time period:
|
||||||
|
Comparison time series settings |
|
More settings for area charts
Options can vary, depending on the chart type and data type.
| Option | Description |
|---|---|
| Label Column |
Specifies the label on the axis that displays the dimension values. The default is the values of the dimension selected to populate the chart. If the columns are too narrow for the dimension value labels to fit, DivePort shows a |
| Slant labels | Specifies that horizontal axis labels are slanted. |
| Label Format |
Applies to date-type and period-type dimensions. Specifies the date label format. For more information, see Spectre Format Conventions. NOTE: For date dimensions, the label format affects the chart hover text only, not the axis label. |
| Scale Type |
Specifies the type of scale. The default is Linear (0, 10, 20, 30...). The other option is Logarithmic (0, 10, 100, 1000...). NOTE: If there are two vertical axes, this setting applies to both axes. |
| Left Axis/Right Axis Settings or Bottom Axis/Top Axis Settings NOTE: Double axes settings apply to Area, Spline Area, Bar, Column, Line, Histogram, Sparkline, and Spline charts.
The |
|
| Scale Minimum |
Specifies the lowest value on the scale. The default, Automatic, calculates the minimum based on the values displayed in the chart. NOTE: This option accepts macros. |
| Scale Maximum |
Specifies the highest value on the scale. The default, Automatic, calculates the maximum based on the values displayed in the chart. NOTE: This option accepts macros. |
| Scale Format |
Sets the format of the scale values. The default, Auto, is based on the format of the first value calculation. NOTE: You can specify a format with up to 20 digits following a decimal point. If you specify more than 20 fractional digits, the extra digits are ignored and the next time you open the Edit Chart Portlet dialog box, the scale format is truncated accordingly. For more information on number formats in DivePort, see Formatting Numeric Values. |
| Option | Description |
|---|---|
| Show Legend |
Adds a legend to the chart. This property is selected by default. Clear the check box if you do not want to include a legend. NOTE: This option is disabled on scatter plot charts unless a Color Column is selected on the Color Settings dialog box. |
| Location |
Specifies where the legend appears on the portlet. NOTE: If, after creating a chart, you edit the chart type, the location of the legend is retained unless you change this option setting. |
| Width/Height |
Specifies the width or height of the legend, in pixels. The default is Automatic, which sets the width/height to fit all names displayed in the legend. NOTE: The full text of the legend does not display if this setting is too low. If this occurs, the legend appears truncated and appended with an ellipsis. |
| Label Column | Applies to arc, chord, pie, and trellis charts. Specifies a dimension whose values you want to use as legend labels. This is useful when multiple dimension values have the same label or when the label has a calculated value appended to it. |
| Colors | Applies to MultiTab charts. Specifies 16 color settings used to display data. |
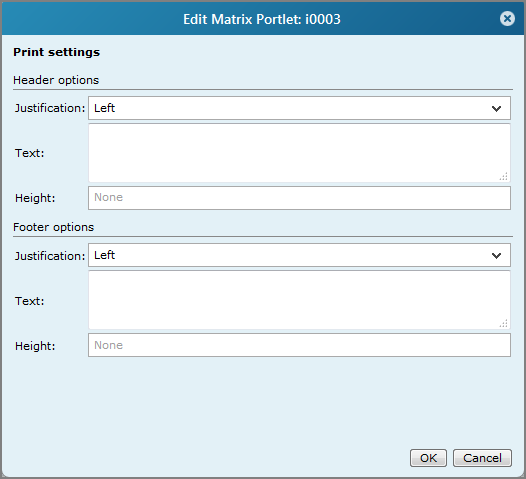
Specifies preferences for printed headers and footers on files that are exported as a result of Excel or PDF click actions.
| Option | Description |
|---|---|
| Title Text | Specifies a title for the chart. |
| Title Font | Specifies the title font style and size. Default is Verdana, 16px, bold. |
| Color | Specifies the title text color, opacity, hue, saturation, and lightness. Default is black. |
| Show numeric data values on chart |
Applies to area and spline area charts. Adds labels to data points on the chart. NOTE: DivePort omits labels that do not fit within the boundaries of the chart or overlap other labels. |
| Display data labels vertically | Available |
Availability varies, depending on the chart type.
| Option | Description |
|---|---|
| Title Text | Specifies a title for the chart. |
| Font | Specifies the title font style, size, color, opacity, hue, saturation, and lightness. Default is Verdana, 16px, bold, black. |
| # Items | Specifies the number of items that display on the chart. For example, setting this option to 4 for a bar chart produces a chart with the top four bars based on the sort value. All items display by default. This option is not available for MultiTab charts. |
| Show Others | If # Items is selected, this option displays the sum of the remaining items. For example, setting # Items to 4 for a bar chart, and then selecting this option produces a chart with the top four bars plus a fifth bar showing the sum of the remaining items. |
| Hide Null Values |
Measure Factory license: This option hides any rows where all of the plotted values are either null, unknown, or 0. Standard license: This option hides any rows where all of the plotted values are either null or unknown. |
| Sort By | Specifies a dimension or value on which to sort. The default is No sort. This option is not available for MultiTab charts. |
| Sort Up | Select if you want the dimension or value to sort up. |
| Sort Down | Select if you want the dimension or value to sort down. |
Applies to area, spline area, and stacked area charts.
Allows you to specify a customized tooltip that opens when a user places the pointer on a data object. Opens a data box in which you can enter HTML content.
If you use Unicode characters, be sure to use the proper encoding and standards.
TIP: When developing HTML content, consider using a text editor or a web design tool to write the code, and then use a copy and paste operation to insert the text into the Contents of hover box dialog box.
Leave the box blank for the default behavior, which is to display the dimension name, value names, and value summary data.
You can use row, column, portlet, and page macros in the tooltip. However, links and other click actions are not supported.
NOTE: When used in macros, the <column name> is not case-sensitive.
| Option | Description |
|---|---|
| Synchronize dimensions with other portlets |
This option works in conjunction with the measures portlet feature, Allow Dimension Changing. When the user changes the dimension on the measures portlet, the change applies to the chart portlet as well. The following conditions must be met:
|
| Interpolation | Applies to spline charts. Specifies the type of interpolation line used on the chart. The default value is Cardinal. The other option is Monotone. |
Bar, Column, Histogram, Sparkcolumn, Stacked Bar, and Stacked Column Charts
In addition to the options that apply to all chart types, the following options apply to bar charts.
Multiple values, which can be customized with Value settings, available by clicking Add a value on the main page:
| Option | Description | ||||||
|---|---|---|---|---|---|---|---|
| Column | Specifies a measure or summary value to use as a column. | ||||||
| Measure Value | Applies to Measure Factory. Specifies whether to use the measure value or |
||||||
|
|
Opens the time series mode settings box. Options are Basic |
||||||
| Basic time series settings |
Basic features are as follows:
|
||||||
|
Advanced time series settings |
Advanced features allow the following customization of the time period:
|
||||||
|
Comparison time series settings |
|
||||||
| Label | Specifies a label for the value column. The column name is the default label. This option accepts portlet-level macros. | ||||||
| Color | Specifies the color of the data value. | ||||||
| Axis | Specifies the location of the Axis scale. Depending on the chart type, the default is Left or Bottom. Other options are Right or Top. | ||||||
| Show Mean | Indicates that the mean value is drawn on the chart. You can specify a color and style for the line as well as whether or not a label is included. NOTE: If selected, the Label displays as MEAN: <number>. | ||||||
| Show Median | Indicates that the median value is drawn on the chart. You can specify a color and style for the line as well as whether or not a label is included. NOTE: If selected, the Label displays as MEDIAN: <number>. |
MultiTab Bar, MultiTab Column, MultiTab Stacked Bar, and MultiTab Stacked Column Charts
In addition to the options that apply to all chart types, the following options apply to MultiTab bar and MultiTab column charts.
| Option | Description | ||||||
|---|---|---|---|---|---|---|---|
| Category |
Specifies a secondary dimension that is used in MultiTab charts to divide the first dimension's data into categories. |
||||||
| Value | Specifies a measure or summary value to display on the chart. | ||||||
|
|
Opens the time series mode settings box. Options are Basic |
||||||
| Basic time series settings |
Basic features are as follows:
|
||||||
|
Advanced time series settings |
Advanced features allow the following customization of the time period:
|
||||||
|
Comparison time series settings |
|
In addition to the options that apply to all chart types, the following options apply to waterfall charts.
| Option | Description | ||||||
|---|---|---|---|---|---|---|---|
| Time Range |
Specifies a time range. |
||||||
|
|
Opens the time series mode settings box. Options are Basic |
||||||
| Basic time series settings |
Basic features are as follows:
|
||||||
|
Advanced time series settings |
Advanced features allow the following customization of the time period:
|
||||||
| Colors |
Specifies the colors of the bars:
|
||||||
| End Label | Specifies a label for the Total bar. The default label is Final. |
In addition to the options that apply to all chart types, the following options apply to Gantt charts.
| Option | Description |
|---|---|
| Start Value | Specifies the start date of the tracked project. This value can be a date, datetime, period, or numeric value. |
| End Value | Specifies the end date of the tracked project. This value can be a date, datetime, period, or numeric value. |
| Value Format | Specifies the format of the data. This is reflected in tooltips and in the $(ROW_VALUE) macro. |
More settings for bar charts
| Option | Description |
|---|---|
| Label Column |
Specifies the label on the axis that displays the dimension values. The default is the values of the dimension selected to populate the chart. If the columns are too narrow for the dimension value labels to fit, DivePort shows a subset of the labels only. |
| Slant labels | Specifies that horizontal axis labels are slanted. |
| Label Format |
Applies to date-type and period-type dimensions. Specifies the date label format. For more information, see Spectre Format Conventions. NOTE: For date dimensions, the label format affects the chart hover text only, not the axis label. |
| Label Width |
Applies to bar charts. Specifies the width of the vertical axis label, in pixels. Labels that are longer than this width are truncated and appended with an ellipses. Labels that are shorter than this width are right-justified. Setting this option to 0 hides the labels. |
| Label Format | Applies to date dimensions. For more information, see Spectre Format Conventions. |
| Scale Type |
Applies to histogram and sparkcolumn charts. Specifies the type of scale. The default is Linear (0, 10, 20, 30...). The other option is Logarithmic (0, 10, 100, 1000...). NOTE: If there are two vertical axes, this setting applies to both axes. |
| Always include zero |
Available when the Scale Minimum is set to Automatic. Ensures that the scale includes 0. NOTE: Under certain conditions, such as when the scale minimum or maximum value is set to 0, this option is set automatically and cannot be changed. |
| Left Axis/Right Axis Settings or Bottom Axis/Top Axis Settings NOTE: Double axes settings apply to Area, Spline Area, Bar, Column, Line, Histogram, Sparkline, and Spline charts.
The |
|
| Scale Minimum |
Specifies the lowest value on the scale. The default, Automatic, calculates the minimum based on the values displayed in the chart. NOTE: This option accepts macros. |
| Scale Maximum |
Specifies the highest value on the scale. The default, Automatic, calculates the maximum based on the values displayed in the chart. NOTE: This option accepts macros. |
| Scale Format |
Sets the format of the scale values. The default, Auto, is based on the format of the first value calculation. NOTE: You can specify a format with up to 20 digits following a decimal point. If you specify more than 20 fractional digits, the extra digits are ignored and the next time you open the Edit Chart Portlet dialog box, the scale format is truncated accordingly. For more information on number formats in DivePort, see Formatting Numeric Values. |
| Horizontal axis (Values) Applies to Gantt charts | |
| Scale Minimum |
Specifies the lowest value on the horizontal axis. The default, Automatic, calculates the minimum based on the values displayed in the chart. This setting requires a valid ISO format. This option accepts macros. NOTE: If a task ends before the scale minimum, it does not appear on the chart. |
| Scale Maximum |
Specifies the highest value on the horizontal axis. The default, Automatic, calculates the maximum based on the values displayed in the chart.This setting requires a valid ISO format. This option accepts macros. NOTE: If a task starts after the scale maximum, it does not appear on the chart. |
| Scale Format |
Sets the format of the horizontal axis values. For more information on number formats in DivePort, see Formatting Numeric Values. |
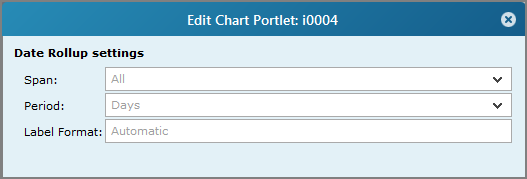
| Option | Description |
|---|---|
| Span | Specifies the span of time for the chart data. The default is All. Other options are Full Year, |
| Period | Specifies a time period. Available options depend on the Span setting, and include Years, Months, Quarters, and Days. |
| Label Format | Specifies the date label format. For more information, see Spectre Format Conventions. |
NOTES:
- If the span is set to All, setting the period to Days is equivalent to no date rollup. In that case, setting the label format affects tooltips and $(ROW_STRING) macros only. The specified format is not applied to the chart axis label.
- When the current month has fewer days than the previous month, you can use any date format string except for the Full Month / Days date roll-up.
- You cannot specify a date rollup and time-series date range on the same portlet.
- Full Year (filter out future dates) filters out data from dates beyond the complete date.
| Option | Description |
|---|---|
| Show Legend |
Adds a legend to the chart. This property is selected by default. Clear the check box if you do not want to include a legend. NOTE: This option is disabled on Gantt charts and scatter plot charts unless a Color Column is selected on the Color Settings dialog box. |
| Location |
Specifies where the legend appears on the portlet. NOTE: If, after creating a chart, you edit the chart type, the location of the legend is retained unless you change this option setting. |
| Height |
Specifies the height of the legend, in pixels. The default is Automatic, which sets the height to fit all names displayed in the legend. NOTE: The full text of the legend does not display if this setting is too low. If this occurs, the legend appears truncated and appended with an ellipsis. |
| Label Column | Applies to MultiTab charts. Specifies a dimension whose values you want to use as legend labels. This is useful when multiple dimension values have the same label or when the label has a calculated value appended to it. |
| Colors | Applies to MultiTab charts. Specifies 16 color settings used to display data. |
Applies to Gantt charts.
| Option | Description |
|---|---|
| Color column | Specifies the category dimension. |
| Colors | Specifies eight color settings used to display task data. |
Specifies preferences for printed headers and footers on files that are exported as a result of Excel or PDF click actions.
| Option | Description |
|---|---|
| Title Text | Specifies a title for the chart. |
| Title Font | Specifies the title font style and size. Default is Verdana, 16px, bold. |
| Color | Specifies the title text color, opacity, hue, saturation, and lightness. Default is black. |
| Show numeric data values on chart |
By default, the text color is white or black, depending on the color of the bar. However, the color can be customized in the skin option portletChartDataLabelColor=rgb(50, 50, 50). NOTE: DivePort omits labels that do not fit within the boundaries of the chart or overlap other labels. |
| Show numeric totals on chart |
NOTE: DivePort omits labels that do not fit within the boundaries of the chart, column chart labels that are more than three times wider than the corresponding column, and bar chart labels that are taller than the corresponding bar. |
| Display data labels vertically | Available |
| Show row names on chart |
Applies to Gantt charts. Adds task labels to the bars. By default, the text color is white or black, depending on the color of the bar. However, the color can be customized in the skin option portletChartDataLabelColor=rgb(50, 50, 50). NOTE: DivePort omits labels that do not fit within the boundaries of the chart or overlap other labels. |
| Option | Description |
|---|---|
| Synchronize dimensions with other portlets |
This option works in conjunction with the measures portlet feature, Allow Dimension Changing. When the user changes the dimension on the measures portlet, the change applies to the chart portlet as well. The following conditions must be met:
|
| Use min and max as summaries for numeric columns | Applies to Gantt chart start and end values. |
Applies to Gantt charts. Specifies task dependencies and adds connection arrows to the chart.
NOTE: Dependencies are defined in the cBase.
| Option | Description |
|---|---|
| Finish to Start | Draws an arrow from the end of the fundamental task to the beginning of the dependent task. |
| Start to Start | Draws an arrow from the beginning of the fundamental task to the beginning of the dependent task. |
| Finish to Finish | Draws an arrow from the end of the fundamental task to the end of the dependent task. |
| Start to Finish | Draws an arrow from the beginning of the fundamental task to the end of the dependent task. |
Click Add a value to open the Value settings page.
Value settings
| Option | Description |
|---|---|
| Column | Specifies the dependency column as defined in the cBase. |
| Label | Specifies the display name for the dependancy. |
| Color | Specifies the color of the arrow. Default is Black. |
| Line style | Specifies the style of the arrow line. The default is Solid. Other options are Dashed and Dotted. |
Applies to bar, column, Gantt, histogram, stacked bar, stacked column, and waterfall charts.
Allows you to specify a customized tooltip that opens when a user places the pointer on a data object. Opens a data box in which you can enter HTML content.
If you use Unicode characters, be sure to use the proper encoding and standards.
TIP: When developing HTML content, consider using a text editor or a web design tool to write the code, and then use a copy and paste operation to insert the text into the Contents of hover box dialog box.
Leave the box blank for the default behavior, which is to display the dimension name, value names, and value summary data.
You can use row, column, portlet, and page macros in the tooltip. However, links and other click actions are not supported.
NOTE: When used in macros, the <column name> is not case-sensitive.
MultiTab bars do not offer the display settings options.
| Option | Description |
|---|---|
| # Items | Specifies the number of items that display on the chart. For example, setting this option to 4 for a bar chart produces a chart with the top four bars based on the sort value. All items display by default. This option is not available for MultiTab charts. |
| Filter | Specifies a measure or Spectre calculation that is used to filter the data that displays. |
| Show Others | If # Items is selected, this option displays the sum of the remaining items. For example, setting # Items to 4 for a bar chart, and then selecting this option produces a chart with the top four bars plus a fifth bar showing the sum of the remaining items. |
| Hide Null Values |
Measure Factory license: This option hides any rows where all of the plotted values are either null, unknown, or 0. Standard license: This option hides any rows where all of the plotted values are either null or unknown. |
| Sort By | Specifies a dimension or value on which to sort. The default is No sort. This option is not available for MultiTab charts. |
| Sort Up | Select if you want the dimension or value to sort up. |
| Sort Down | Select if you want the dimension or value to sort down. |
| Bar height | Applies to Gantt charts. Specifies the height of each bar as a proportion to the maximum bar height. Options are between 0.05 to 1.0. |
In addition to the options that apply to all chart types, the following options apply to calendar heatmatrix charts.
| Option | Description |
|---|---|
| Date Format | Specifies the date format. The default is Automatic, which uses the format specified in the date dimension. For more information, see . |
| Default View | Specifies how much time appears on the calendar. Default is Month. Other options are Year and Multi-Year. |
| Year Style |
Specifies how the months appear on a Year or Multi-Year chart. The default is Grid. The other option is Linear. See About Calendar Heatmatrix Charts. |
| Navigable | Adds options to the calendar that allow users to change the year style plus next and previous arrows. |
More settings for calendar charts
| Option | Description |
|---|---|
| Show Legend |
Adds a legend to the chart. This property is selected by default. Clear the check box if you do not want to include a legend. NOTE: This option is disabled on scatter plot charts unless a Color Column is selected on the Color Settings dialog box. |
| Location |
Specifies where the legend appears on the portlet. NOTE: If, after creating a chart, you edit the chart type, the location of the legend is retained unless you change this option setting. |
| Width |
Specifies the width of the legend, in pixels. The default is Automatic, which sets the width to fit all names displayed in the legend. NOTE: The full text of the legend does not display if this setting is too low. If this occurs, the legend appears truncated and appended with an ellipsis. |
| Option | Description |
|---|---|
| Color Scale Type | Specifies how the color scale uses color. The default is Gradient. The other option is Threshold. NOTE: Selecting Threshold opens a new page where you can set the threshold values. |
| Use Mid | Adds a mid-point to the scale legend. |
| Min/Mid/Max Color | Available when the Gradient scale type is selected. Specifies the colors used on the low, middle, and high points on the scale. The default values are red, yellow, and green. |
| Min/Mid/Max Value | Specifies the data values that display the Min/Mid/Max colors. The default, Automatic uses the source data low, average, and high values. NOTE: Values outside of the Min/Max value range display on the chart, but their value cannot be determined by the legend. |
Specifies preferences for printed headers and footers on files that are exported as a result of Excel or PDF click actions.
| Option | Description |
|---|---|
| Title Text | Specifies a title for the chart. |
| Title Font | Specifies the title font style and size. Default is Verdana, 16px, bold. |
| Color | Specifies the title text color, opacity, hue, saturation, and lightness. Default is black. |
| Option | Description |
|---|---|
| Synchronize dimensions with other portlets |
This option works in conjunction with the measures portlet feature, Allow Dimension Changing. When the user changes the dimension on the measures portlet, the change applies to the chart portlet as well. The following conditions must be met:
|
| Value Text Color | Available when Show values is selected. Specifies the color of the cell text. |
| Blank Cell Color | Specifies the cell color when the cell value is blank. |
Allows you to specify a customized tooltip that opens when a user places the pointer on a data object. Opens a data box in which you can enter HTML content.
If you use Unicode characters, be sure to use the proper encoding and standards.
TIP: When developing HTML content, consider using a text editor or a web design tool to write the code, and then use a copy and paste operation to insert the text into the Contents of hover box dialog box.
Leave the box blank for the default behavior, which is to display the dimension name, value names, and value summary data.
You can use row, column, portlet, and page macros in the tooltip. However, links and other click actions are not supported.
NOTE: When used in macros, the <column name> is not case-sensitive.
Combination chart
In addition to the options that apply to all chart types, the following options apply to combination charts.
Additional values, with customizable Value settings. To add a value, select Add a value on the main page:
| Option | Description | ||||
|---|---|---|---|---|---|
| Column | Specifies a value column. | ||||
| Measure Value | Applies to Measure Factory. Specifies whether to use the measure value or |
||||
|
|
Applies to Measure Factory. Opens the time series mode settings box. Options are Basic |
||||
| Basic time series settings |
Basic features are as follows:
|
||||
| Type |
Specifies the type of secondary chart. The default is Line. Other options are Area, TIP: Under More settings > Advanced, you can opt to stack the charts. |
||||
| Color | Specifies the color of the data value. | ||||
| Point Style | Applies to line and spline charts. Specifies the shape of the data points. The default is None. Other options are Circle, Square, X, Diamond, Triangle Up, and Triangle Down. | ||||
| Line Style | Applies to line and spline charts. Specifies the appearance of the line. The default is Solid. Other options are Thick, Dashed, and Dotted. | ||||
| Axis |
Specifies the location of the Axis scale. For combination charts, the default is Left. The other option is Right. You can select a different axis for different values. |
||||
| Show Mean |
Shows the data mean on the chart. Selecting this option enables the color and line type choice lists, and the Label check box for the mean line. NOTE: If selected, the Label displays as MEAN: <number>. |
||||
| Show Median |
Shows the data median on the chart. Selecting this option enables the color and line type choice lists, and the Label check box for the median line. NOTE: If selected, the Label displays as MEDIAN: <number>. |
||||
| Label | Specifies a label for the value column. The column name is the default label. This option accepts portlet-level macros. |
Trellis chart
In addition to the options that apply to all chart types, the following options apply to trellis charts.
| Option | Description |
|---|---|
| Subchart Type |
Specifies the appearance of the individual charts that when combined, make up the trellis chart. The default is Column. Other options are Area, MultiTab Area, MultiTab Spline Area, MultiTab Stacked Area, Spline Area, Bar, Histogram, MultiTab Bar, MultiTab Column, MultiTab Stacked Bar, MultiTab Stacked Column, Line, MultiTab Line, MultiTab Sparkline, MultiTab Spline, Sparkline, and Spline. |
| Category |
Specifies a secondary dimension that is used to define the subchart dimension. |
| Group | Available with MultiTab Subcharts. Specifies a tertiary dimension that is used in MultiTab subcharts to divide the first dimension's data into categories. |
Additional values, with customizable Value settings. To add a value, select Add a value on the main page.
| Option | Description |
|---|---|
| Column | Specifies a value column. |
| Label | Specifies a label for the value column. The column name is the default label. This option accepts portlet-level macros. |
| Type | Specifies the type of secondary chart. The default is Line. Other options are Area, Column, Spline, and Spline Area. |
| Color | Specifies the color of the data value. |
| Show Mean |
Shows the data mean on the chart. Selecting this option enables the color and line type choice lists, and the Label check box for the mean line. NOTE: If selected, the Label displays as MEAN: <number>. |
| Show Median |
Shows the data median on the chart. Selecting this option enables the color and line type choice lists, and the Label check box for the median line. NOTE: If selected, the Label displays as MEDIAN: <number>. |
More settings for combination charts
| Option | Description |
|---|---|
| Label Column | Specifies a dimension whose values you want to use as labels on the horizontal axis The default is the values of the dimension selected to populate the chart. If the columns are too narrow for the dimension value labels to fit, DivePort shows a subset of the labels only. |
| Slant labels | Specifies that horizontal axis labels are slanted. |
| Label Format | Applies to date dimensions. For more information, see Spectre Format Conventions. |
| Scale Type |
Specifies the type of scale. The default is Linear (0, 10, 20, 30...). The other option is Logarithmic (0, 10, 100, 1000...). NOTE: If there are two vertical axes, this setting applies to both axes. |
| Always include zero |
Available when the Scale Minimum is set to Automatic. Ensures that the scale includes 0. NOTE: Under certain conditions, such as when the scale minimum or maximum value is set to 0, this option is set automatically and cannot be changed. |
| Match zeros |
Available on line charts and spline charts. Positions the zero-point at the same height in both left and right axes. Clear this option to disable this feature. NOTES: Under certain conditions, such as when the scale minimum and maximum value is the same for both axes, this option is set automatically and cannot be changed. Similarly, if the axes scales do not align, such as when the scale minimum on one axis is equal to the scale maximum on the other axis, this option is cleared automatically and cannot be changed. In other chart types, you can override the match-zeros default behavior by setting a minimum and maximum scale value for both right and left axes. |
| Left Axis/Right Axis Settings or Bottom Axis/Top Axis Settings NOTE: Double axes settings apply to Area, Spline Area, Bar, Column, Line, Histogram, Sparkline, and Spline charts.
The |
|
| Scale Minimum |
Specifies the lowest value on the scale. The default, Automatic, calculates the minimum based on the values displayed in the chart. NOTE: This option accepts macros. |
| Scale Maximum |
Specifies the highest value on the scale. The default, Automatic, calculates the maximum based on the values displayed in the chart. NOTE: This option accepts macros. |
| Scale Format |
Sets the format of the scale values. The default, Auto, is based on the format of the first value calculation. NOTE: You can specify a format with up to 20 digits following a decimal point. If you specify more than 20 fractional digits, the extra digits are ignored and the next time you open the Edit Chart Portlet dialog box, the scale format is truncated accordingly. For more information on number formats in DivePort, see Formatting Numeric Values. |
| Option | Description |
|---|---|
| Show Legend |
Adds a legend to the chart. This property is selected by default. Clear the check box if you do not want to include a legend. NOTE: This option is disabled on scatter plot charts unless a Color Column is selected on the Color Settings dialog box. |
| Location |
Specifies where the legend appears on the portlet. NOTE: If, after creating a chart, you edit the chart type, the location of the legend is retained unless you change this option setting. |
| Width |
Specifies the width of the legend, in pixels. The default is Automatic, which sets the width to fit all names displayed in the legend. NOTE: The full text of the legend does not display if this setting is too low. If this occurs, the legend appears truncated and appended with an ellipsis. |
Specifies preferences for printed headers and footers on files that are exported as a result of Excel or PDF click actions.
| Option | Description |
|---|---|
| Title Text | Specifies a title for the chart. |
| Title Font | Specifies the title font style and size. Default is Verdana, 16px, bold. |
| Color | Specifies the title text color, opacity, hue, saturation, and lightness. Default is black. |
Applies to combination charts
| Option | Description |
|---|---|
| Synchronize dimensions with other portlets |
This option works in conjunction with the measures portlet feature, Allow Dimension Changing. When the user changes the dimension on the measures portlet, the change applies to the chart portlet as well. The following conditions must be met:
|
| Interpolation | Applies to combination/spline charts. Specifies the type of interpolation line used on the chart. The default value is Cardinal. The other option is Monotone. |
| Stack Columns | Applies to combination charts. Specifies that the bar charts are stacked instead of being drawn side-by-side. |
| Stack Areas |
Applies to combination charts. Specifies that the area charts are |
Allows you to specify a customized tooltip that opens when a user places the pointer on a data object. Opens a data box in which you can enter HTML content.
If you use Unicode characters, be sure to use the proper encoding and standards.
TIP: When developing HTML content, consider using a text editor or a web design tool to write the code, and then use a copy and paste operation to insert the text into the Contents of hover box dialog box.
Leave the box blank for the default behavior, which is to display the dimension name, value names, and value summary data.
You can use row, column, portlet, and page macros in the tooltip. However, links and other click actions are not supported.
NOTE: When used in macros, the <column name> is not case-sensitive.
Arc chart
In addition to the options that apply to all chart types, the following options apply to arc charts.
| Option | Description |
|---|---|
| Source Column | Specifies the dimension that is used as a departure point for paths on the chart. |
| Target Column | Specifies the dimension that is used as an arrival point for paths on the chart. Target column values that match source column values display as a single node on the chart. |
| Orientation | Specifies the orientation of the chart. The default is Horizontal axis with arcs above. Other options are Horizontal axis with arcs below, Vertical axis with arcs right, and Vertical axis with arcs left. |
| Colors: Forward | Specifies the color of the arcs if the connection between nodes is in the forward direction. (Left to Right or Top to Bottom.) |
| Colors: Backward | Specifies the color of the arcs if the connection between nodes is in the backwards direction. (Right to Left or Bottom to Top.) |
More settings for arc charts
| Option | Description |
|---|---|
| Label Column | Specifies a dimension whose values you want to use as labels on the axis that displays the dimension values. The default is the values of the dimension selected to populate the chart. If the columns are too narrow for the dimension value labels to fit, DivePort shows a subset of the labels only. |
| Label Format |
Applies to date-type and period-type dimensions. Specifies the date label format. For more information, see Spectre Format Conventions. NOTE: For date dimensions, the label format affects the chart hover text only, not the axis label. |
| Label Width | Applies to charts with a vertical orientation. Specifies the width of the vertical axis label, in pixels. The default Automatic, uses the dimension values to determine the width. Labels that are longer than this width setting are truncated and appended with an ellipses. Labels that are shorter than this width are right-justified. |
| Show labels | Specifies that node labels appear on the chart. This option is selected by default. |
| Slant labels | Applies to charts with a horizontal orientation. Specifies that node labels are slanted. This option is selected by default. |
| Option | Description |
|---|---|
| Show Legend |
Adds a legend to the chart. This property is selected by default. Clear the check box if you do not want to include a legend. NOTE: This option is disabled on scatter plot charts unless a Color Column is selected on the Color Settings dialog box. |
| Location |
Specifies where the legend appears on the portlet. NOTE: If, after creating a chart, you edit the chart type, the location of the legend is retained unless you change this option setting. |
| Width/Height |
Specifies the width or height of the legend, in pixels. The default is Automatic, which sets the width/height to fit all names displayed in the legend. NOTE: The full text of the legend does not display if this setting is too low. If this occurs, the legend appears truncated and appended with an ellipsis. |
| Label Column | Applies to MultiTab, arc, chord pie, and trellis charts. Specifies a dimension whose values you want to use as legend labels. This is useful when multiple dimension values have the same label or when the label has a calculated value appended to it. |
| Forward label | Identifies the forward direction. The default is Left to Right or Top to Bottom. |
| Backward label | Identifies the backward direction. The default is Right to Left or Bottom to Top. |
Specifies preferences for printed headers and footers on files that are exported as a result of Excel or PDF click actions.
| Option | Description |
|---|---|
| Title Text | Specifies a title for the chart. |
| Title Font | Specifies the title font style and size. Default is Verdana, 16px, bold. |
| Color | Specifies the title text color, opacity, hue, saturation, and lightness. Default is black. |
| Shorten labels to <n> characters |
Specifies the maximum number of characters that labels display. When this option is selected, the label is truncated, and appended with an ellipsis. NOTE: The ellipsis counts as three characters. The full label displays when you place your pointer on the arc. |
| Option | Description |
|---|---|
| Synchronize dimensions with other portlets |
This option works in conjunction with the measures portlet feature, Allow Dimension Changing. When the user changes the dimension on the measures portlet, the change applies to the chart portlet as well. The following conditions must be met:
|
Chord chart
In addition to the options that apply to all chart types, the following options apply to chord charts.
| Option | Description |
|---|---|
| Source Column | Specifies the dimension that is used as a departure point for paths on the chart. |
| Target Column | Specifies the dimension that is used as an arrival point for paths on the chart. Target column values that match source column values display as a single node on the chart. |
More settings for chord charts
| Option | Description |
|---|---|
| Label Column | Specifies a dimension whose values you want to use as legend labels. This is useful when multiple dimension values have the same label or when the label has a calculated value appended to it. |
| Colors | Specifies 16 color settings used to display data. |
Specifies preferences for printed headers and footers on files that are exported as a result of Excel or PDF click actions.
| Option | Description |
|---|---|
| Title Text | Specifies a title for the chart. |
| Title Font | Specifies the title font style and size. Default is Verdana, 16px, bold. |
| Color | Specifies the title text color, opacity, hue, saturation, and lightness. Default is black. |
| Shorten labels to <n> characters |
Specifies the maximum number of characters that labels display. When this option is selected, the label is truncated, and appended with an ellipsis. NOTE: The ellipsis counts as three characters. The full label displays when you place your pointer on the label. |
Sankey diagram
In addition to the options that apply to all chart types, the following options apply to Sankey diagrams.
NOTE: If the data source is Dive file or marker, the first dimension is used as the source dimension and the second dimension is uses as the target dimension. If there is a third dimension, it is used as the position dimension. Otherwise, automatic positioning is used.
| Option | Description | ||||||
|---|---|---|---|---|---|---|---|
| Source dimension | Specifies the dimension that is used as a beginning node for the flow. | ||||||
| Target dimension | Specifies the dimension that is used as an end node for the flow. | ||||||
| Determine flow positions | Specifies if the nodes are positioned automatically or based on the position dimension. The default is Based on dimension. The other option is Automatically. | ||||||
| Select a position dimension | Specifies the placement of the nodes. Nodes at the same position are placed in the same column. | ||||||
| Select a value | Specifies the weight of the link. | ||||||
| Measure Value | Applies to Measure Factory. Specifies whether to use the measure value or |
||||||
|
|
Applies to Measure Factory. Opens the time series mode settings box. Options are Basic |
||||||
| Basic time series settings |
Basic features are as follows:
|
||||||
|
Advanced time series settings |
Advanced features allow the following customization of the time period:
|
||||||
|
Comparison time series settings |
|
||||||
| Orientation | Specifies if the data flows horizontally or vertically. |
More settings for Sankey diagrams
| Option | Description |
|---|---|
| Flows | Specifies the color of the flow lines. |
| Stages | Specifies the colors for up to 15 nodes. |
Specifies preferences for printed headers and footers on files that are exported as a result of Excel or PDF click actions.
| Option | Description |
|---|---|
| Title Text | Specifies a title for the diagram. |
| Title Font | Specifies the title font style and size. Default is Verdana, 16px, bold. |
| Color | Specifies the title text color, opacity, saturation, and lightness. Default is black. |
| Shorten labels to <n> characters |
Specifies the maximum number of characters that display for node labels. When this option is selected, the label is truncated, and appended with an ellipsis. NOTE: The ellipsis counts as three characters. The full label displays when you place your pointer on the label. |
Node sort order specifies if the nodes in each stage are sorted:
-
None places the nodes in a way that minimizes the number of overlapping links.
-
Up or Down sorts the nodes in each stage according to their data type. Strings are sorted alphabetically, integers are sorted numerically, and dates are sorted by time.
| Option | Description |
|---|---|
| Synchronize dimensions with other portlets |
This option works in conjunction with the measures portlet feature, Allow Dimension Changing. When the user changes the dimension on the measures portlet, the change applies to the chart portlet as well. The following conditions must be met:
|
| Limit depth of highlight upon node click to <n> links | Specifies a limit to the depth of highlighting links when a node is clicked. The selected node is highlighted as well as the links within this depth setting. |
Specifies the tooltip text that displays when the pointer is placed on a flow line. The default behavior is to display the source, target, and value.
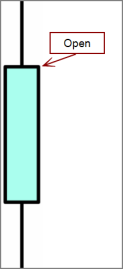
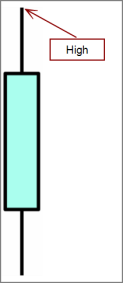
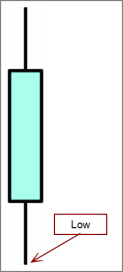
Candlestick and Open-high-low-close charts
In addition to the options that apply to all chart types, the following options apply to candlestick charts and open-high-low-close charts.
| Option | Description |
|---|---|
| Open |
Specifies the value at the |
| High |
Specifies the |
| Low |
Specifies the |
More settings for finance charts
| Option | Description |
|---|---|
| Label Column | Specifies a dimension whose values you want to use as labels on the axis that displays the dimension values. The default is the values of the dimension selected to populate the chart. If the columns are too narrow for the dimension value labels to fit, DivePort shows a subset of the labels only. |
| Slant labels | Specifies that horizontal axis labels are slanted. |
| Label Format |
Applies to date-type and period-type dimensions. Specifies the date label format. For more information, see Spectre Format Conventions. NOTE: For date dimensions, the label format affects the chart hover text only, not the axis label. |
| Always include zero |
Available when the Scale Minimum is set to Automatic. Ensures that the scale includes 0. NOTE: Under certain conditions, such as when the scale minimum or maximum value is set to 0, this option is set automatically and cannot be changed. |
| Scale Minimum |
Specifies the lowest value on the scale. The default, Automatic, calculates the minimum based on the values displayed in the chart. NOTE: This option accepts macros. |
| Scale Maximum |
Specifies the highest value on the scale. The default, Automatic, calculates the maximum based on the values displayed in the chart. NOTE: This option accepts macros. |
| Scale Format |
Sets the format of the scale values. The default, Automatic, is based on the format of the first value calculation. NOTE: You can specify a format with up to 20 digits following a decimal point. If you specify more than 20 fractional digits, the extra digits are ignored and the next time you open the Edit Chart Portlet dialog box, the scale format is truncated accordingly. For more information on number formats in DivePort, see Formatting Numeric Values. |
| Option | Description |
|---|---|
| Title Text | Specifies a title for the chart. |
| Title Font | Specifies the title font style and size. Default is Verdana, 16px, bold. |
| Color | Specifies the title text color, opacity, hue, saturation, and lightness. Default is black. |
| Option | Description |
|---|---|
| Synchronize dimensions with other portlets |
This option works in conjunction with the measures portlet feature, Allow Dimension Changing. When the user changes the dimension on the measures portlet, the change applies to the chart portlet as well. The following conditions must be met:
|
Allows you to specify a customized tooltip that opens when a user places the pointer on a data object. Opens a data box in which you can enter HTML content.
If you use Unicode characters, be sure to use the proper encoding and standards.
TIP: When developing HTML content, consider using a text editor or a web design tool to write the code, and then use a copy and paste operation to insert the text into the Contents of hover box dialog box.
Leave the box blank for the default behavior, which is to display the dimension name, value names, and value summary data.
You can use row, column, portlet, and page macros in the tooltip. However, links and other click actions are not supported.
NOTE: When used in macros, the <column name> is not case-sensitive.
Line, Sparkline, and Spline charts
In addition to the options that apply to all chart types, the following options apply to line, sparkline, and spline charts.
Additional values, with customizable Value settings. To add a value, click Add a value on the main page.
| Option | Description | ||||||
|---|---|---|---|---|---|---|---|
| Column | Specifies a measure or summary value to use as a column. | ||||||
| Measure Value | Applies to Measure Factory. Specifies whether to use the measure value or |
||||||
|
|
Applies to Measure Factory. Opens the time series mode settings box. Options are Basic and Advanced. | ||||||
| Basic time series settings |
Basic features are as follows:
|
||||||
|
Advanced time series settings |
Advanced features allow the following customization of the time period:
|
||||||
| Time Range (Advanced) |
Specifies a <time range> to complete <date>. |
||||||
| Offset (Advanced) | Specifies an offset value to apply to the time series. | ||||||
| Label | Specifies a label for the value column. The column name is the default label. This option accepts portlet-level macros. | ||||||
| Color | Specifies the color of the data value. | ||||||
| Point Style | Applies to line and spline charts. Specifies the shape of the data points. The default is None. Other options are Circle, Square, X, Diamond, Triangle Up, and Triangle Down. | ||||||
| Line Style | Applies to line and spline charts. Specifies the appearance of the line. The default is Solid. Other options are Thick, Dashed, and Dotted. | ||||||
| Axis | Applies to line and spline charts. Specifies the location of the Axis scale. Depending on the chart type, the default is Left or Bottom. Other options are Right or Top. | ||||||
| Show Mean |
Shows the data mean on the chart. Selecting this option enables the color and line type choice lists, and for line and spline charts only, the Label check box for the mean line. NOTE: If selected, the Label displays as MEAN: <number>. |
||||||
| Show Median |
Shows the data median on the chart. Selecting this option enables the color and line type choice lists, and for line and spline charts only, the Label check box for the median line. NOTE: If selected, the Label displays as MEDIAN: <number>. |
More settings for line charts
| Option | Description |
|---|---|
| Label Column | Specifies a dimension whose values you want to use as labels on the horizontal axis. The default is the values of the dimension selected to populate the chart. If the columns are too narrow for the dimension value labels to fit, DivePort shows a subset of the labels only. |
| Slant labels | Specifies that horizontal axis labels are slanted. |
| Label Format |
Applies to date-type and period-type dimensions. Specifies the date label format. For more information, see Spectre Format Conventions. NOTE: For date dimensions, the label format affects the chart hover text only, not the axis label. |
| Scale Type |
Specifies the type of scale. The default is Linear (0, 10, 20, 30...). The other option is Logarithmic (0, 10, 100, 1000...). NOTE: If there are two vertical axes, this setting applies to both axes. |
| Always include zero |
Available when the Scale Minimum is set to Automatic. Ensures that the scale includes 0. NOTE: Under certain conditions, such as when the scale minimum or maximum value is set to 0, this option is set automatically and cannot be changed. |
| Scale Minimum |
Specifies the lowest value on the scale. The default, Automatic, calculates the minimum based on the values displayed in the chart. NOTE: This option accepts macros. |
| Scale Maximum |
Specifies the highest value on the scale. The default, Automatic, calculates the maximum based on the values displayed in the chart. NOTE: This option accepts macros. |
| Option | Description |
|---|---|
| Span | Specifies the span of time for the chart data. The default is All. Other options are Full Year |
| Period | Specifies a time period. Available options depend on the Span setting, and include Years, Months, Quarters, and Days. |
| Label Format | Specifies the date label format. For more information, see Spectre Format Conventions. |
NOTES:
- If the span is set to All, setting the period to Days is equivalent to no date rollup. In that case, setting the label format affects tooltips and $(ROW_STRING) macros only. The specified format is not applied to the chart axis label.
- When the current month has fewer days than the previous month, you can use any date format string except for the Full Month / Days date roll-up.
- You cannot specify a date rollup and time-series date range on the same portlet.
- Full Year (filter out future dates) filters out data from dates beyond the complete date.
Applies to line and spline charts.
| Option | Description |
|---|---|
| Show Legend |
Adds a legend to the chart. This property is selected by default. Clear the check box if you do not want to include a legend. NOTE: This option is disabled on scatter plot charts unless a Color Column is selected on the Color Settings dialog box. |
| Location |
Specifies where the legend appears on the portlet. NOTE: If, after creating a chart, you edit the chart type, the location of the legend is retained unless you change this option setting. |
| Width |
Specifies the width of the legend, in pixels. The default is Automatic, which sets the width to fit all names displayed in the legend. NOTE: The full text of the legend does not display if this setting is too low. If this occurs, the legend appears truncated and appended with an ellipsis. |
Specifies preferences for printed headers and footers on files that are exported as a result of Excel or PDF click actions.
| Option | Description |
|---|---|
| Title Text | Specifies a title for the chart. |
| Title Font | Specifies the title font style and size. Default is Verdana, 16px, bold. |
| Color | Specifies the title text color, opacity, hue, saturation, and lightness. Default is black. |
| Show numeric data values on chart |
Applies to line and spline charts. Adds labels to data points on the chart. NOTE: DivePort omits labels that do not fit within the boundaries of the chart or overlap other labels. |
| Display data labels vertically | Available |
| Option | Description |
|---|---|
| # Items | Specifies the number of items that display on the chart. For example, setting this option to 4 for a bar chart produces a chart with the top four bars based on the sort value. All items display by default. This option is not available for MultiTab charts. |
| Filter | Specifies a measure or Spectre calculation that is used to filter the data that displays. |
| Show Others | If # Items is selected, this option displays the sum of the remaining items. For example, setting # Items to 4 for a bar chart, and then selecting this option produces a chart with the top four bars plus a fifth bar showing the sum of the remaining items. |
| Hide Null Values |
Measure Factory license: This option hides any rows where all of the plotted values are either null, unknown, or 0. Standard license: This option hides any rows where all of the plotted values are either null or unknown. |
| Sort By | Specifies a dimension or value on which to sort. The default is No sort. This option is not available for MultiTab charts. |
| Sort Up | Select if you want the dimension or value to sort up. |
| Sort Down | Select if you want the dimension or value to sort down. |
| Option | Description |
|---|---|
| Synchronize dimensions with other portlets |
This option works in conjunction with the measures portlet feature, Allow Dimension Changing. When the user changes the dimension on the measures portlet, the change applies to the chart portlet as well. The following conditions must be met:
|
| Interpolation | Applies to spline charts. Specifies the type of interpolation line used on the chart. The default value is Cardinal. The other option is Monotone. |
Applies to line and spline charts. Allows you to specify a customized tooltip that opens when a user places the pointer on a data object. Opens a data box in which you can enter HTML content.
If you use Unicode characters, be sure to use the proper encoding and standards.
TIP: When developing HTML content, consider using a text editor or a web design tool to write the code, and then use a copy and paste operation to insert the text into the Contents of hover box dialog box.
Leave the box blank for the default behavior, which is to display the dimension name, value names, and value summary data.
You can use row, column, portlet, and page macros in the tooltip. However, links and other click actions are not supported.
NOTE: When used in macros, the <column name> is not case-sensitive.
MultiTab Line, MultiTab Sparkline, and MultiTab Spline charts
In addition to the options that apply to all chart types, the following options apply to MultiTab line, MultiTab sparkline, and MultiTab spline charts.
| Option | Description | ||||||
|---|---|---|---|---|---|---|---|
| Category | Specifies a secondary dimension that is used in MultiTab charts to divide the first dimension's data into categories. | ||||||
| Measure Value | Applies to Measure Factory. Specifies whether to use the measure value or |
||||||
|
|
Applies to Measure Factory. Opens the time series mode settings box. Options are Basic and Advanced. | ||||||
| Basic time series settings |
Basic features are as follows:
|
||||||
|
Advanced time series settings |
Advanced features allow the following customization of the time period:
|
||||||
| Time Range (Advanced) |
Specifies a <time range> to complete <date>. |
||||||
| Offset (Advanced) | Specifies an offset value to apply to the time series. |
More settings for MultiTab line charts
| Option | Description |
|---|---|
| Label Column | Specifies a dimension whose values you want to use as labels on the horizontal axis The default is the values of the dimension selected to populate the chart. If the columns are too narrow for the dimension value labels to fit, DivePort shows a subset of the labels only. |
| Label Format |
Applies to date-type and period-type dimensions. Specifies the date label format. For more information, see Spectre Format Conventions. NOTE: For date dimensions, the label format affects the chart hover text only, not the axis label. |
| Scale Type |
Specifies the type of scale. The default is Linear (0, 10, 20, 30...). The other option is Logarithmic (0, 10, 100, 1000...). NOTE: If there are two vertical axes, this setting applies to both axes. |
| Always include zero |
Available when the Scale Minimum is set to Automatic. Ensures that the scale includes 0. NOTE: Under certain conditions, such as when the scale minimum or maximum value is set to 0, this option is set automatically and cannot be changed. |
| Scale Minimum |
Specifies the lowest value on the scale. The default, Automatic, calculates the minimum based on the values displayed in the chart. NOTE: This option accepts macros. |
| Scale Maximum |
Specifies the highest value on the scale. The default, Automatic, calculates the maximum based on the values displayed in the chart. NOTE: This option accepts macros. |
Applies to MultiTab Line and MultiTab Spline charts.
| Option | Description |
|---|---|
| Show Legend |
Adds a legend to the chart. This property is selected by default. Clear the check box if you do not want to include a legend. NOTE: This option is disabled on scatter plot charts unless a Color Column is selected on the Color Settings dialog box. |
| Location |
Specifies where the legend appears on the portlet. NOTE: If, after creating a chart, you edit the chart type, the location of the legend is retained unless you change this option setting. |
| Width |
Specifies the width of the legend, in pixels. The default is Automatic, which sets the width to fit all labels displayed in the legend. NOTE: The full text of the legend does not display if this setting is too low. If this occurs, the legend appears truncated and appended with an ellipsis. |
| Label Column | Specifies a dimension whose values you want to use as legend labels. This is useful when multiple dimension values have the same label or when the label has a calculated value appended to it. |
| Colors | Specifies 16 color settings used to display data. |
Specifies preferences for printed headers and footers on files that are exported as a result of Excel or PDF click actions.
| Option | Description |
|---|---|
| Title Text | Specifies a title for the chart. |
| Title Font | Specifies the title font style and size. Default is Verdana, 16px, bold. |
| Color | Specifies the title text color, opacity, hue, saturation, and lightness. Default is black. |
| Show numeric data values on chart |
Applies to MultiTab line and MultiTab spline charts. Adds labels to data points on the chart. NOTE: DivePort omits labels that do not fit within the boundaries of the chart or overlap other labels. |
| Display data labels vertically | Available |
Specifies preferences for printed headers and footers on files that are exported as a result of Excel or PDF click actions.
| Option | Description |
|---|---|
| Synchronize dimensions with other portlets |
This option works in conjunction with the measures portlet feature, Allow Dimension Changing. When the user changes the dimension on the measures portlet, the change applies to the chart portlet as well. The following conditions must be met:
|
Stringline charts
In addition to the options that apply to all chart types, the following options apply to stringline charts.
| Option | Description |
|---|---|
| Category | Specifies a secondary dimension that is used in MultiTab charts to divide the first dimension's data into categories. |
Additional values, with customizable Value settings. To add a value, click Add a value on the main page.
| Option | Description | ||||||
|---|---|---|---|---|---|---|---|
| Column | Specifies a measure or summary value to use as a column. | ||||||
| Measure Value | Applies to Measure Factory. Specifies whether to use the measure value or |
||||||
|
|
Applies to Measure Factory. Opens the time series mode settings box. Options are Basic |
||||||
| Basic time series settings |
Basic features are as follows:
|
||||||
|
Advanced time series settings |
Advanced features allow the following customization of the time period:
|
||||||
|
Comparison time series settings |
|
||||||
| Label | Specifies a label for the value column. The column name is the default label. This option accepts portlet-level macros. | ||||||
| Color | Specifies the color of the data value. | ||||||
| Point Style | Applies to line and spline charts. Specifies the shape of the data points. The default is None. Other options are Circle, Square, X, Diamond, Triangle Up, and Triangle Down. | ||||||
| Line Style | Applies to line and spline charts. Specifies the appearance of the line. The default is Solid. Other options are Thick, Dashed, and Dotted. |
More settings for stringline charts
| Option | Description |
|---|---|
| Flip axes | Applies to stringline charts. Swaps the vertically-displayed dimension data with the horizontally-displayed value information. |
| Label Column | Specifies a dimension whose values you want to use as labels on the horizontal axis The default is the values of the dimension selected to populate the chart. If the columns are too narrow for the dimension value labels to fit, DivePort shows a subset of the labels only. |
| Label Format |
Applies to date-type and period-type dimensions. Specifies the date label format. For more information, see Spectre Format Conventions. NOTE: For date dimensions, the label format affects the chart hover text only, not the axis label. |
| Label Width |
Applies to charts with a vertical major axis displaying dimension data. Specifies the width of the major axis label, in pixels. Labels that are longer than this width are truncated and appended with an ellipses. Labels that are shorter than this width are right-justified. Setting this option to 0 hides the labels. |
| Slant labels | Available when the dimension is displayed on the horizontal axis (Flip axes is selected). Specifies that horizontal axis labels are slanted. |
| Scale Type |
Specifies the type of scale. The default is Linear (0, 10, 20, 30...). The other option is Logarithmic (0, 10, 100, 1000...). NOTE: If there are two vertical axes, this setting applies to both axes. |
| Always include zero |
Available when the Scale Minimum is set to Automatic. Ensures that the scale includes 0. NOTE: Under certain conditions, such as when the scale minimum or maximum value is set to 0, this option is set automatically and cannot be changed. |
| Scale Minimum |
Specifies the lowest value on the scale. The default, Automatic, calculates the minimum based on the values displayed in the chart. NOTE: This option accepts macros. |
| Scale Maximum |
Specifies the highest value on the scale. The default, Automatic, calculates the maximum based on the values displayed in the chart. NOTE: This option accepts macros. |
| Scale Format |
Sets the format of the scale values. The default, Auto, is based on the format of the first value calculation. NOTE: You can specify a format with up to 20 digits following a decimal point. If you specify more than 20 fractional digits, the extra digits are ignored and the next time you open the Edit Chart Portlet dialog box, the scale format is truncated accordingly. For more information on number formats in DivePort, see Formatting Numeric Values. |
Applies to line and spline charts.
| Option | Description |
|---|---|
| Show Legend |
Adds a legend to the chart. This property is selected by default. Clear the check box if you do not want to include a legend. NOTE: This option is disabled on scatter plot charts unless a Color Column is selected on the Color Settings dialog box. |
| Location |
Specifies where the legend appears on the portlet. T NOTE: If, after creating a chart, you edit the chart type, the location of the legend is retained unless you change this option setting. |
| Height |
Specifies the height of the legend, in pixels. The default is Automatic, which sets the height to fit all names displayed in the legend. NOTE: The full text of the legend does not display if this setting is too low. If this occurs, the legend appears truncated and appended with an ellipsis. |
Specifies preferences for printed headers and footers on files that are exported as a result of Excel or PDF click actions.
| Option | Description |
|---|---|
| Title Text | Specifies a title for the chart. |
| Title Font | Specifies the title font style and size. Default is Verdana, 16px, bold. |
| Color | Specifies the title text color, opacity, hue, saturation, and lightness. Default is black. |
| Option | Description |
|---|---|
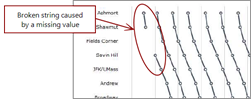
| Ignore missing values |
Applies to stringline charts. Specifies that a missing value does not cause the string to break, and all points are connected on the line.
|
| Option | Description |
|---|---|
| Synchronize dimensions with other portlets |
This option works in conjunction with the measures portlet feature, Allow Dimension Changing. When the user changes the dimension on the measures portlet, the change applies to the chart portlet as well. The following conditions must be met:
|
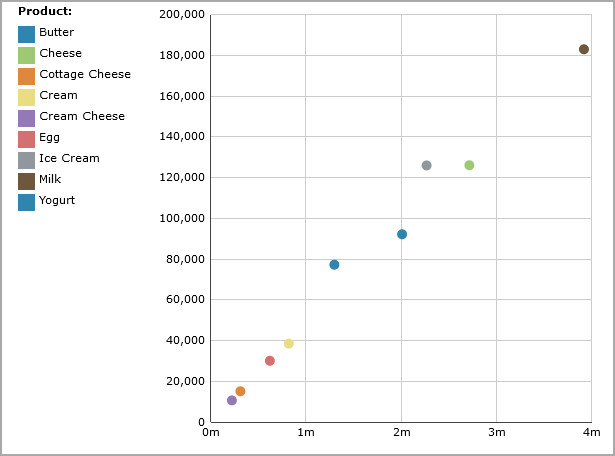
Scatter plot chart
In addition to the options that apply to all chart types, the following options apply to scatter plot charts.
| Option | Description |
|---|---|
| X | Specifies the data that is plotted on the horizontal axis. |
| Y | Specifies the data that is plotted on the vertical axis. |
More settings for scatter plot charts
Separate axes settings are available for both horizontal and vertical axes.
| Option | Description |
|---|---|
| Label Column | Specifies a dimension whose values you want to use as labels on the horizontal axis The default is the values of the dimension selected to populate the chart. If the columns are too narrow for the dimension value labels to fit, DivePort shows a subset of the labels only. |
| Slant labels | Specifies that horizontal axis labels are slanted. |
| Scale Type |
Specifies the type of scale. The default is Linear (0, 10, 20, 30...). The other option is Logarithmic (0, 10, 100, 1000...). NOTE: If there are two vertical axes, this setting applies to both axes. |
| Always include zero |
Available when the Scale Minimum is set to Automatic. Ensures that the scale includes 0. NOTE: Under certain conditions, such as when the scale minimum or maximum value is set to 0, this option is set automatically and cannot be changed. |
| Scale Minimum |
Specifies the lowest value on the scale. The default, Automatic, calculates the minimum based on the values displayed in the chart. NOTE: This option accepts macros. |
| Scale Maximum |
Specifies the highest value on the scale. The default, Automatic, calculates the maximum based on the values displayed in the chart. NOTE: This option accepts macros. |
| Scale Format |
Sets the format of the scale values. The default, Automatic, is based on the format of the first value calculation. NOTE: You can specify a format with up to 20 digits following a decimal point. If you specify more than 20 fractional digits, the extra digits are ignored and the next time you open the Edit Chart Portlet dialog box, the scale format is truncated accordingly. For more information on number formats in DivePort, see Formatting Numeric Values. |
| Option | Description |
|---|---|
| Show Legend |
Adds a legend to the chart. NOTE: This option is available only if a Color Column is selected on the Color Settings dialog box. |
| Location |
Specifies where the legend appears on the portlet. The NOTE: If, after creating a chart, you edit the chart type, the location of the legend is retained unless you change this option setting. |
| Height |
Specifies the height of the legend, in pixels. The default is Automatic, which sets the height to fit all names displayed in the legend. NOTE: The full text of the legend does not display if this setting is too low. If this occurs, the legend appears truncated and appended with an ellipsis. |
| Option | Description |
|---|---|
| Color Column | Specifies the column that you are customizing. Up to eight colors can be defined for different dimension values. |
| Column Label | Specifies a heading label for the legend. This option accepts macros. |
| Show column name in legend |
Adds a heading (column label) to the chart legend.
|
| Time Range |
Specifies the time range for data inclusion. |
| Period |
Specifies the time period of the data. |
| Scale Minimum | Specifies the lowest value on the scale. The default, Automatic, calculates the minimum based on the values displayed in the chart. NOTE: Macros are not supported options. |
| Scale Maximum | Specifies the highest value on the scale. The default, Automatic, calculates the maximum based on the values displayed in the chart. NOTE: Macros are not supported options. |
| Colors |
Specifies the range of colors of the data points. If no column is selected at the top of this dialog box, the first color in the list is used for all points.
|
| Option | Description |
|---|---|
| Size Column | Defines a column that represents the point size. Higher column values display larger points. |
| Scale Minimum | Specifies the lowest value on the scale. The default, Automatic, calculates the minimum based on the values displayed in the chart. NOTE: Macros are not supported options. |
| Scale Maximum | Specifies the highest value on the scale. The default, Automatic, calculates the maximum based on the values displayed in the chart. NOTE: Macros are not supported options. |
| Point Size Minimum | Specifies the minimum size of the data points, in pixels. The default is 2. |
| Point Size Maximum | Specifies the maximum size of the data points, in pixels. The default is 10. |
| Option | Description |
|---|---|
| Show Means | Indicates that the mean value of both axes are drawn on the chart. You can specify a color and style for the line as well as whether or not a label is included. NOTE: If selected, the Labels display as MEAN: <number>. |
| Show Medians | Indicates that the median value of both axes are drawn on the chart. You can specify a color and style for the line as well as whether or not a label is included. NOTE: If selected, the Labels display as MEDIAN: <number>. |
Specifies preferences for printed headers and footers on files that are exported as a result of Excel or PDF click actions.
| Option | Description |
|---|---|
| Title Text | Specifies a title for the chart. |
| Title Font | Specifies the title font style and size. Default is Verdana, 16px, bold. |
| Color | Specifies the title text color, opacity, hue, saturation, and lightness. Default is black. |
| Option | Description |
|---|---|
| Synchronize dimensions with other portlets |
This option works in conjunction with the measures portlet feature, Allow Dimension Changing. When the user changes the dimension on the measures portlet, the change applies to the chart portlet as well. The following conditions must be met:
|
Allows you to specify a customized tooltip that opens when a user places the pointer on a data object. Opens a data box in which you can enter HTML content.
If you use Unicode characters, be sure to use the proper encoding and standards.
TIP: When developing HTML content, consider using a text editor or a web design tool to write the code, and then use a copy and paste operation to insert the text into the Contents of hover box dialog box.
Leave the box blank for the default behavior, which is to display the dimension name, value names, and value summary data.
You can use row, column, portlet, and page macros in the tooltip. However, links and other click actions are not supported.
NOTE: When used in macros, the <column name> is not case-sensitive.
Heatmatrix charts
In addition to the options that apply to all chart types, the following options apply to heatmatrix charts.
| Option | Description | ||||||
|---|---|---|---|---|---|---|---|
| Category |
Specifies a secondary dimension that is used to split the first dimension's data into categories. |
||||||
| Measure Value | Applies to Measure Factory. Specifies whether to use the measure value or |
||||||
|
|
Applies to Measure Factory. Opens the time series mode settings box. Options are Basic |
||||||
| Basic time series settings |
Basic features are as follows:
|
||||||
|
Advanced time series settings |
Advanced features allow the following customization of the time period:
|
||||||
| Time Range (Advanced) |
Specifies a <time range> to complete <date>. |
||||||
| Offset (Advanced) | Specifies an offset value to apply to the time series. |
Mosaic charts
In addition to the options that apply to all chart types, the following options apply to mosaic charts.
| Option | Description | ||||||
|---|---|---|---|---|---|---|---|
| X Dimension | Specifies the dimension whose values populate the horizontal axis. | ||||||
| Y Dimension | Specifies the dimension whose values populate the vertical axis. | ||||||
| Measure Value | Applies to Measure Factory. Specifies whether to use the measure value or |
||||||
| Align | Specifies if the bars are drawn vertically or horizontally. | ||||||
|
|
Applies to Measure Factory. Opens the time series mode settings box. Options are Basic and Advanced. | ||||||
| Basic time series settings |
Basic features are as follows:
|
||||||
|
Advanced time series settings |
Advanced features allow the following customization of the time period:
|
||||||
| Time Range (Advanced) |
Specifies a <time range> to complete <date>. |
||||||
| Offset (Advanced) | Specifies an offset value to apply to the time series. |
Treemap
In addition to the options that apply to all chart types, the following options apply to treemaps.
| Option | Description | ||||||
|---|---|---|---|---|---|---|---|
| Category |
Specifies a dimension that is used to group the first dimension's data into categories. |
||||||
| Measure Value | Applies to Measure Factory. Specifies whether to use the measure value or |
||||||
|
|
Applies to Measure Factory. Opens the time series mode settings box. Options are Basic and Advanced. | ||||||
| Basic time series settings |
Basic features are as follows:
|
||||||
|
Advanced time series settings |
Advanced features allow the following customization of the time period:
|
||||||
| Time Range (Advanced) |
Specifies a <time range> to complete <date>. |
||||||
| Offset (Advanced) | Specifies an offset value to apply to the time series. |
More settings for MultiTab charts
| Option | Description |
|---|---|
| Label Column | Specifies a dimension whose values you want to use as labels on the specified axis The default is the values of the dimension selected to populate the chart. |
| Slant labels | Specifies that horizontal axis labels are slanted. |
| Option | Description |
|---|---|
| Show Legend |
Adds a legend to the chart. |
| Location |
Specifies where the legend appears on the portlet. The NOTE: If, after creating a chart, you edit the chart type, the location of the legend is retained unless you change this option setting. |
| Width |
Specifies the width of the legend, in pixels. The default is Automatic, which sets the width to fit all names displayed in the legend. NOTE: The full text of the legend does not display if this setting is too low. If this occurs, the legend appears truncated and appended with an ellipsis. |
| Colors | Applies to mosaic and treemap charts. Specifies 16 color settings used to display data. |
Applies to heatmatrix charts.
| Option | Description |
|---|---|
| Color Scale Type |
Specifies how the color scale uses color. The default is Gradient. The other options are Threshold and Binned. Selecting Threshold opens a new page where you can set the threshold values. Selecting Binned opens a new page where you can set the number of bins |
| Use Mid | Adds a mid-point to the scale legend. |
| Min/Mid/Max Color | Available when the Gradient scale type is selected. Specifies the colors used on the low, middle, and high points on the scale. The default values are red, yellow, and green. |
| Min/Mid/Max Value | Specifies the data values that display the Min/Mid/Max colors. The default, Automatic uses the source data low, average, and high values. NOTE: Values outside of the Min/Max value range display on the chart, but their value cannot be determined by the legend. |
Applies to heatmatrix
| Option | Description |
|---|---|
| Title Text |
|
| Font |
|
| Show every cell | Applies to treemap charts. Specifies that all tiles are drawn on the chart. |
| Show n cells | Applies to treemap charts. Specifies the maximum number of tiles displayed in each category minus one. If the category has more than n values, the remaining values are grouped into a tile called Others. |
| Show at least n % | Applies to treemap charts. Specifies the minimum value displayed on a tile when the summaries are shown as a percentage of the whole. All % values less than n are grouped into a tile called Others. |
Specifies preferences for printed headers and footers on files that are exported as a result of Excel or PDF click actions.
Applies to
| Option | Description |
|---|---|
| Title Text | Specifies a title for the chart. |
| Title Font | Specifies the title font style and size. Default is Verdana, 16px, bold. |
| Color |
|
| Show dimension labels | Applies to treemap charts. Specifies inclusion of dimension value labels in the top left corner of the tiles. Labels appear only if they fit in the tile. |
| Show summary labels | Applies to treemap charts. Specifies inclusion of summary values in the bottom or center of the tiles. Labels appear only if they fit in the tile. |
| Label Font | Applies to treemap charts. Defines the font style of the dimension and summary labels. |
| Label Color | Applies to treemap charts. Defines the color of the dimension and summary labels. |
| Label Column | Applies to treemap charts. Specifies a dimension label that is used on the tiles instead of the default label. |
| Show summaries as | Applies to treemap charts. Specifies if the summary values display as numeric sum or a percentage of the whole. |
| Summary format | Applies to treemap charts. Specifies the format of the summary values. See Formatting Numeric Values. |
| Option | Description |
|---|---|
| Synchronize dimensions with other portlets |
This option works in conjunction with the measures portlet feature, Allow Dimension Changing. When the user changes the dimension on the measures portlet, the change applies to the chart portlet as well. The following conditions must be met:
|
| Show Values | Applies to heatmatrix charts. Displays the data value in each cell. |
| Values Text Color | Available when the Show Values advanced option is selected. Specifies the color of the text that appears in the portlet cells. The default is #000000 (black). |
| Blank Cell Color | Applies to heatmatrix charts. Specifies the fill color for cells without data. |
Donut and Pie charts
In addition to the options that apply to all chart types, the following options apply to donut and pie charts.
| Option | Description | ||||||
|---|---|---|---|---|---|---|---|
| Measure Value | Applies to Measure Factory. Specifies whether to use the measure value or |
||||||
|
|
Applies to Measure Factory. Opens the time series mode settings box. Options are Basic and Advanced. | ||||||
| Basic time series settings |
Basic features are as follows:
|
||||||
|
Advanced time series settings |
Advanced features allow the following customization of the time period:
|
||||||
| Time Range (Advanced) |
Specifies a <time range> to complete <date>. |
||||||
| Offset (Advanced) | Specifies an offset value to apply to the time series. |
More settings for pie charts
| Option | Description |
|---|---|
| Show Legend |
Adds a legend to the chart. This property is selected by default. Clear the check box if you do not want to include a legend. NOTE: This option is disabled on scatter plot charts unless a Color Column is selected on the Color Settings dialog box. |
| Show % Value |
Adds the percent values for each wedge to the chart |
| Location |
Specifies where the legend appears on the portlet. The default is Right, which displays the legend in the top right corner of the portlet. Other options are Left (top left corner) Top (centered above the chart), and Bottom (centered below the chart). NOTE: If, after creating a chart, you edit the chart type, the location of the legend is retained unless you change this option setting. |
| Width |
Specifies the width of the legend, in pixels. The default is Automatic, which sets the width to fit all names displayed in the legend. NOTE: The full text of the legend does not display if this setting is too low. If this occurs, the legend appears truncated and appended with an ellipsis. |
| Label Column | Specifies a dimension whose values you want to use as legend labels. This is useful when multiple dimension values have the same label or when the label has a calculated value appended to it. |
| Colors | Specifies 16 color settings used to display data. |
| Assign colors based on original data sort |
Assigns colors to dimension values based on the original order of dimension values, instead of descending value order. This allows you to consistently assign the same color to specific values. NOTE: If there are more than 16 values on the chart, this option can result in adjacent wedges with the same color. |
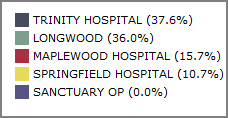
| Option | Description |
|---|---|
| Title Text | Specifies a title for the chart. |
| Title Font | Specifies the title font style and size. Default is Verdana, 16px, bold. |
| Color | Specifies the title text color, opacity, hue, saturation, and lightness. Default is black. |
Applies to charts that use a cPlan, cBase, or factory file as its source.
| Option | Description |
|---|---|
| # Items | Specifies the number of items that display on the chart. For example, setting this option to 4 for a bar chart produces a chart with the top four bars based on the sort value. All items display by default. This option is not available for MultiTab charts. |
| Filter | Specifies a measure or Spectre calculation that is used to filter the data that displays. |
| Sort wedges by size, descending | Sorts pie and donut charts from the largest wedge to the smallest wedge, starting in the top right of the chart. This is the default and recommended setting. |
| Sort wedges by dimension value |
Sorts pie and donut charts in the same order as the rows in the data source, starting in the top right of the chart. This option disables the # Items display option, and also disables the automatic inclusion of an Others wedge when there are many values. |
| Option | Description |
|---|---|
| Synchronize dimensions with other portlets |
This option works in conjunction with the measures portlet feature, Allow Dimension Changing. When the user changes the dimension on the measures portlet, the change applies to the chart portlet as well. The following conditions must be met:
|
Allows you to specify a customized tooltip that opens when a user places the pointer on a data object. Opens a data box in which you can enter HTML content.
If you use Unicode characters, be sure to use the proper encoding and standards.
TIP: When developing HTML content, consider using a text editor or a web design tool to write the code, and then use a copy and paste operation to insert the text into the Contents of hover box dialog box.
Leave the box blank for the default behavior, which is to display the dimension name, value names, and value summary data.
You can use row, column, portlet, and page macros in the tooltip. However, links and other click actions are not supported.
NOTE: When used in macros, the <column name> is not case-sensitive.
Box Plot and Horizontal Box Plot charts
Available options depend on the data source type and DivePort version.
In addition to the options that apply to all chart types, you can specify a Level that specifies a subdivision for the Value column data. The Level default is Detail.
In addition to the options that apply to all chart types, the following options apply to box plot and horizontal box plot charts.
| Option | Description |
|---|---|
| Max |
Specifies the |
| High |
Specifies the |
| Mid |
Specifies the |
| Low |
Specifies the |
| Min |
Specifies the |
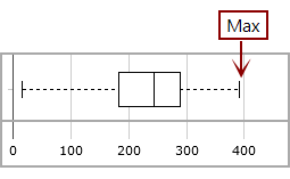
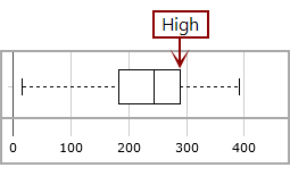
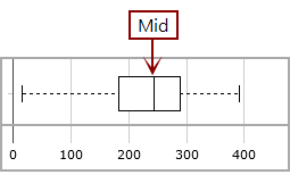
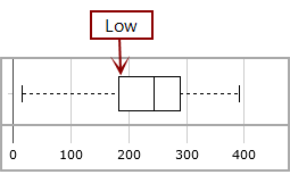
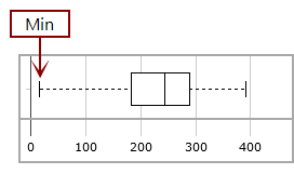
More settings for statistic charts
| Option | Description |
|---|---|
| Label Column | Specifies a dimension whose values you want to use as labels on the horizontal axis The default is the values of the dimension selected to populate the chart. If the columns are too narrow for the dimension value labels to fit, DivePort shows a subset of the labels only. |
| Slant labels | Specifies that horizontal axis labels are slanted. |
| Always include zero |
Available when the Scale Minimum is set to Automatic. Ensures that the scale includes 0. NOTE: Under certain conditions, such as when the scale minimum or maximum value is set to 0, this option is set automatically and cannot be changed. |
| Scale Minimum |
Specifies the lowest value on the scale. The default, Automatic, calculates the minimum based on the values displayed in the chart. NOTE: This option accepts macros. |
| Scale Maximum |
Specifies the highest value on the scale. The default, Automatic, calculates the maximum based on the values displayed in the chart. NOTE: This option accepts macros. |
| Scale Format |
Sets the format of the scale values. The default, Auto, is based on the format of the first value calculation. NOTE: You can specify a format with up to 20 digits following a decimal point. If you specify more than 20 fractional digits, the extra digits are ignored and the next time you open the Edit Chart Portlet dialog box, the scale format is truncated accordingly. For more information on number formats in DivePort, see Formatting Numeric Values. |
| Option | Description |
|---|---|
| Show Legend |
Adds a legend to the chart. This property is selected by default. Clear the check box if you do not want to include a legend. |
| Location |
Specifies where the legend appears on the portlet. The default for box plots is Right, which displays the legend in the top right corner of the portlet. The default for horizontal box plots is Top, which displays the legend centered above the chart. Other options are Left (top left corner) and Bottom (centered below the chart). NOTE: If, after creating a chart, you edit the chart type, the location of the legend is retained unless you change this option setting. |
| Height/Width |
Specifies the height or width of the legend, in pixels. The default is Automatic, which sets the height or width to fit all names displayed in the legend. NOTE: The full text of the legend does not display if this setting is too low. If this occurs, the legend appears truncated and appended with an ellipsis. |
| Option | Description |
|---|---|
| Span | Specifies the span of time for the chart data. The default is All. Other options are Full Year |
| Period | Specifies a time period. Available options depend on the Span setting, and include Years, Quarters, Months, and Days. |
| Label Format | Specifies the date label format. For more information, see Spectre Format Conventions. |
NOTES:
- If the span is set to All, setting the period to Days is equivalent to no date rollup. In that case, setting the label format affects tooltips and $(ROW_STRING) macros only. The specified format is not applied to the chart axis label.
- When the current month has fewer days than the previous month, you can use any date format string except for the Full Month / Days date rollup.
- You cannot specify a date rollup and time-series date range on the same portlet.
- The current time range is always applied to date rollups.
- Full Year (filter out future dates) filters out data from dates beyond the complete date.
Specifies a column whose value is added as a point on the chart.
On the Additional points dialog box, select Add a value to open the Value settings dialog box.
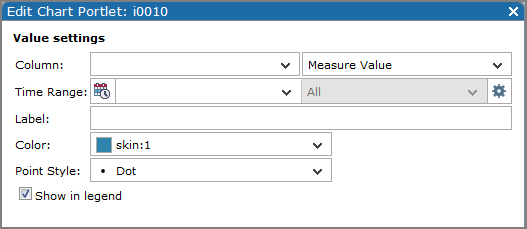
| Option | Description | ||||||
|---|---|---|---|---|---|---|---|
| Column | Specifies the column whose value you want to add to the chart. | ||||||
| Measure Value | Applies to Measure Factory. Specifies whether to use the measure value or | ||||||
| Applies to Measure Factory. Opens the time series mode settings box. Options are Basic and Advanced. | |||||||
| Basic time series settings | Basic features are as follows:
| ||||||
Advanced time series settings | Advanced features allow the following customization of the time period:
| ||||||
| Time Range (Advanced) | Specifies a <time range> to complete <date>. | ||||||
| Offset (Advanced) | Specifies an offset value to apply to the time series. | ||||||
| Label | Specifies the point label that appears on the legend. The default is the column label. | ||||||
| Color | Specifies the point color. The default is black, #000000. | ||||||
| Point Style | Specifies the shape of the point. The default is Dot. Other options are None, Circle, Square, X, Diamond, Triangle Up, and Triangle Down. NOTE: If you set the point style to None, the point is not drawn on the graph; however, the point value is included in the pop-up message that opens when a user places the pointer on the graph. | ||||||
| Show in legend | Specifies if you want the point label to appear in the chart legend. The Legend Setting, Show Legend option must be selected for this setting to take effect. |
| Option | Description |
|---|---|
| Title Text | Specifies a title for the chart. |
| Title Font | Specifies the title font style and size. Default is Verdana, 16px, bold. |
| Color | Specifies the title text color, opacity, hue, saturation, and lightness. Default is black. |
| Option | Description |
|---|---|
| Synchronize dimensions with other portlets |
This option works in conjunction with the measures portlet feature, Allow Dimension Changing. When the user changes the dimension on the measures portlet, the change applies to the chart portlet as well. The following conditions must be met:
|
| Use legacy manual input | Available |
Allows you to specify a customized tooltip that opens when a user places the pointer on a data object. Opens a data box in which you can enter HTML content.
If you use Unicode characters, be sure to use the proper encoding and standards.
TIP: When developing HTML content, consider using a text editor or a web design tool to write the code, and then use a copy and paste operation to insert the text into the Contents of hover box dialog box.
Leave the box blank for the default behavior, which is to display the dimension name, value names, and value summary data.
You can use row, column, portlet, and page macros in the tooltip. However, links and other click actions are not supported.
NOTE: When used in macros, the <column name> is not case-sensitive.