Measures Portlet Options
Available options depend on the type of data and software version.
| Option | Description | ||||||||||||||||||||||
|---|---|---|---|---|---|---|---|---|---|---|---|---|---|---|---|---|---|---|---|---|---|---|---|
| Project |
Specifies the Measure Factory project that provides the data for the portlet. |
||||||||||||||||||||||
|
|
Opens the Select a Data Source dialog box, which you can use to select a different data source file. |
||||||||||||||||||||||
|
|
Opens the source file in another application, such as ProDiver. | ||||||||||||||||||||||
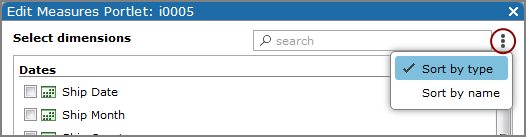
| Select Dimensions |
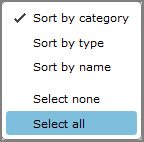
Specifies the primary dimensions that display in the portlet columns. Select the check box to the left of each dimension that you want to display initially. You can use the Search box to locate specific dimensions. Click the Menu icon |
||||||||||||||||||||||
| Span |
Available for date dimensions. Specifies the time span. Options include:
|
||||||||||||||||||||||
| Period |
Available for date dimensions. Specified the time period. Options include
|
||||||||||||||||||||||
| Label Format |
Available for Measure Factory time series. Specifies the format of the time/date column. For example, specifying the format YYYY-MM-DD returns 2020-01-20 for January 20, 2020.
For more information, see Time Series Column Labels. |
||||||||||||||||||||||
|
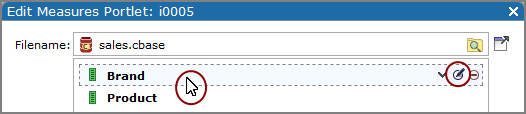
Dimension Settings, Column settings for a specified dimension—Accessible by selecting a dimension and then clicking the Edit this dimension |
|||||||||||||||||||||||
| Title |
Specifies the column label. The default Automatic, uses the dimension name as the column label. |
||||||||||||||||||||||
| Size |
Specifies the column width and optionally, height, in the format <w>x<h>, in pixels. The default Automatic, uses the length of the dimension name as a guideline. This option retains the set width if the dimension changes. |
||||||||||||||||||||||
| Overflow |
Available when the column Size is set to something other than Automatic. Specifies the appearance of the display when the column value is wider than the specified column size. The default Ellipses, displays the data in a single row and adds an ellipsis (...) to each cell that overflows the column width. Other options are Wrap text and Wrap text with hanging indent. NOTES:
|
||||||||||||||||||||||
| Font | Specifies the column font, size, and style used. | ||||||||||||||||||||||
| Color |
Opens a color picker that you can use to select a font color. The default is to use the color defined in the portletMeasuresCellColor skin property. You can use DivePort macros for the color. See also About the Color Pickers. |
||||||||||||||||||||||
| Hide totals row |
|
||||||||||||||||||||||
| Select values settings—Accessible by selecting Add > Text columns or Add > Indicator column on the dimension list page. | |||||||||||||||||||||||
| Constant value |
CAUTION: Using $( ROW_DATA) or $( ROW_STRING) macros in a constant column can result in unexpected formatting. DI recommends that you use column values instead. |
||||||||||||||||||||||
| Values | Specifies the data values to use in the text or indicator column. | ||||||||||||||||||||||
|
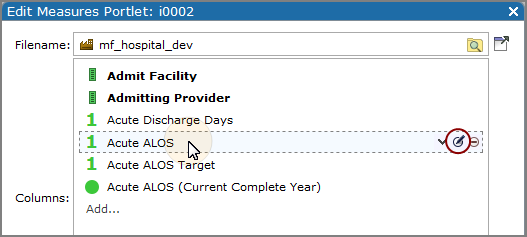
Indicator column settings—Accessible by selecting an indicator column, and then clicking the Edit this column |
|||||||||||||||||||||||
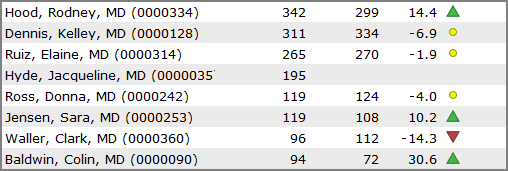
| Type |
Specifies the indicator type. Click the Change the chart icon |
||||||||||||||||||||||
| Title |
Specifies the column heading. The default Automatic, uses the dimension name as the column label. TIP: To display a blank column header, enter a space character. |
||||||||||||||||||||||
| Size | Specifies the column width and optionally, height, in the format <w>x<h>, in pixels. The default, Automatic, uses the length of the dimension name as a guideline. This option retains the set width if the dimension changes. |
||||||||||||||||||||||
| Overflow |
Available when the column Size is set to something other than Automatic. Specifies the appearance of the display when the column value is wider than the specified column size. The default Ellipses, displays the data in a single row and adds an ellipsis (...) to each cell that overflows the column width. Other options are Wrap text and Wrap text with hanging indent. NOTES:
|
||||||||||||||||||||||
| Value | Specifies the data value to display. | ||||||||||||||||||||||
| Auxiliary Measure Value | Specifies a baseline or goal value that is defined in the Measure Factory. | ||||||||||||||||||||||
|
|
Opens the time series mode settings box. Options are Basic, Advanced, and Comparison. | ||||||||||||||||||||||
| Basic time series settings |
Basic features are as follows:
|
||||||||||||||||||||||
|
Advanced time series settings |
Advanced features allow the following customization of the time period:
|
||||||||||||||||||||||
|
Comparison time series settings |
|
||||||||||||||||||||||
|
Colors/Images (formerly Thresholds) |
Click Add a Threshold to open the Threshold settings dialog box, which you can use to set a static or column-based threshold value and indicator Color or Image. Click the gear icon to right of the Time Range to access the
|
||||||||||||||||||||||
| Reverse colors | Used when colors indicate if a data value is good or bad compared to the threshold value. Typically, a higher number is considered good, and lower numbers are bad. Select this option when the goal is met when numbers are lower than the threshold value, and numbers higher than the threshold are not wanted. | ||||||||||||||||||||||
| Show null values with color | Applies to alert, rectangle, and slope indicators. Displays null values as an indicator in the specified color. If this option is not selected, no indicator appears for a null value. | ||||||||||||||||||||||
| More Settings |
Available options depend on the indicator type.
NOTE: Display settings are available for Indicator portlets only. |
||||||||||||||||||||||
| Sorting Settings | |||||||||||||||||||||||
| Allow sorting by clicking column headers | Specifies that column sorting is enabled. The first time a measures portlet column header is clicked, the data is sorted in one direction (ascending order for string columns; descending order for numeric columns). The next click to the same column reverses the sort. This option is selected by default. | ||||||||||||||||||||||
|
Initial sort Sort By |
Specifies the dimension or column on which to sort. The default is No sort. NOTE: Users cannot modify the sort order on the portlet if the data source is a marker or a Spectre Dive file. |
||||||||||||||||||||||
| Sort Up | Select if you want the initial dimension or value to sort up. | ||||||||||||||||||||||
| Sort Down | Select if you want the initial dimension or value to sort down. | ||||||||||||||||||||||
| Drag to change dive order |
Lists the initial dimensions. You can use a drag-and-drop operation to change the dive order. NOTE: This order does not affect the column order on the portlet. |
||||||||||||||||||||||

|
Resets the sort order of the initial dimension list. Options are Undo changes (restore the order to the way it was when you first visited the page) and Match display order (restore the order to match the way the dimensions appear in the portlet). | ||||||||||||||||||||||
| Diving Settings | |||||||||||||||||||||||
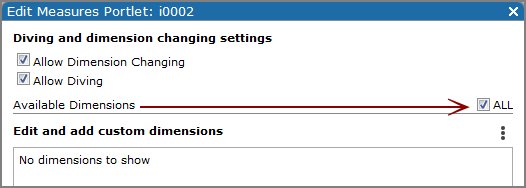
| Allow Dimension Changing |
Enables the user to change a dimension that displays on the portlet to a dimension listed as an Available Dimension. When enabled, a user can click the dimension column heading to display a |
||||||||||||||||||||||
| Allow diving | Enables the user to dive on a dimension listed as an Available Dimension. | ||||||||||||||||||||||
| Allow diving off of search results | Applies when the Miscellaneous setting, Enable quick search option is selected. Enables the ability to dive on the quick search display page. | ||||||||||||||||||||||
|
Available Dimensions |
Specifies which dimensions are available for diving or replacing an initial dimension. You can select ALL, or clear the ALL check box to select any number of individual dimensions.
NOTE: Spectre does not allow changing or diving on columns that are defined as a double data type, and therefore they are not listed as available. |
||||||||||||||||||||||
| Search box |
If the ALL check box is clear, you can use the Search box to locate specific dimensions. |
||||||||||||||||||||||
|
|
Opens a
|
||||||||||||||||||||||
| Edit display order |
Opens the Diving and dimension changing settings dialog box showing the list of selected initial and available dimensions. You can use a drag-and-drop operation to reorder the list. You can click Select dimensions to return to the Diving and dimension changing settings dialog box. |
||||||||||||||||||||||
| Add custom dimension | Applies to Measure Factory projects. Allows you to add dimensions that do not appear in the data source, such as dates with a date rollup applied. | ||||||||||||||||||||||
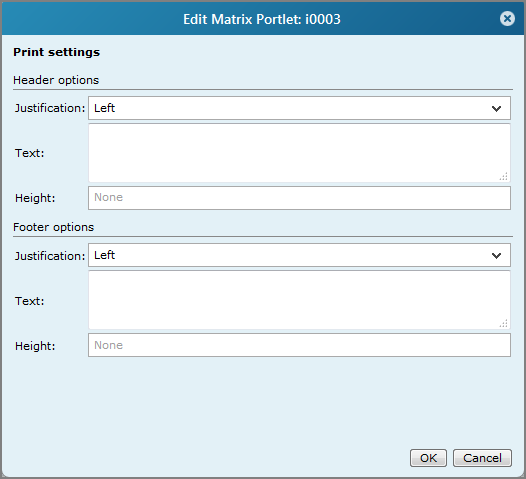
| Printing Settings |
Opens the Print Settings |
||||||||||||||||||||||
| Display Settings | |||||||||||||||||||||||
| # Items |
Specifies the number of items that display on the portlet. For example, setting this option to 5 produces a measures portlet with five rows showing the top five items based on the sort value. All items display by default. |
||||||||||||||||||||||
| Filter | Specifies a measure or Spectre calculation that is used to filter the data that displays. You can use DivePort macros in this expression; however, to be evaluated, the macro call must not appear within string literals (quotation marks). | ||||||||||||||||||||||
| Show Others |
If # Items is selected, this option displays the sum of the remaining items. For example setting # Items to 5, and then selecting this option produces a portlet with the top five items plus a sixth row showing the sum of the remaining items. |
||||||||||||||||||||||
| Hide Null Values |
If # Items is selected, this option does not display items with values that are all null or unknown. NOTE: This does not hide dimension values if there are any values that are not null or unknown in the row. |
||||||||||||||||||||||
| Show Totals |
Specifies that the Totals row from the source data file displays on the portlet. This option is cleared by default.
|
||||||||||||||||||||||
| Show Titles | Specifies that the column headings shown in the Column, Type, Stack table on this dialog box appear as column headings on the measures portlet display. This option is selected by default. | ||||||||||||||||||||||
| Allow Sorting | Specifies that column sorting is enabled. The first time a measures portlet column is clicked, the data is sorted in one direction (ascending order for string columns; descending order for numeric columns). The next click to the same column reverses the sort. This option is selected by default. | ||||||||||||||||||||||
| Show Odd Row Coloring |
Specifies that the row You can edit the following skin properties to control the coloring:
|
||||||||||||||||||||||
| Blank Window Text | Specifies that a message appears on the measures portlet if there are no rows in the data. The message can come from the data if the data source is a marker, or it can be specified in the text box. If the message is in HTML format, the portal's html-rendering-policy determines how it appears. By default, HTML is sanitized, which removes all JavaScript before it is rendered. See also Modifying the Portal Info Attributes in the portaldb.json File. | ||||||||||||||||||||||
| Miscellaneous Settings | |||||||||||||||||||||||
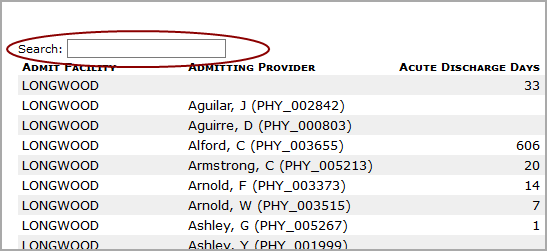
| Enable quick search |
Adds a search box to the portlet. Helps the user to find data in a portlet.
For more information, see About Quick Search. |
||||||||||||||||||||||
| Fixed Columns |
Specifies the number of columns, starting from the left, that are fixed in place if a horizontal scroll bar is needed. If any columns are stacked, this setting indicates the number of stacks, not actual columns. |
||||||||||||||||||||||
| Print Portlet PDF Instead of Page | Specifies that the Print to PDF option produces a pdf version of the portlet instead of the entire DivePort page. If multiple portlets have this option set, the pdf renders each portlet on a new page. | ||||||||||||||||||||||
| Include Parent Info | Available when Print Portlet PDF Instead of Page is selected. Adds information about parent dives to the pdf output. | ||||||||||||||||||||||
| Default Item Height /Minimum Item Height |
Defines the minimum row height, in pixels. The default, auto, is defined as 20.
|
||||||||||||||||||||||
| Text Settings Applies to text indicator columns | |||||||||||||||||||||||
| Font | Specifies the font style and size of the text indicator. The default is Auto. | ||||||||||||||||||||||
| Justification | Specifies the text horizontal alignment in the column. The default is Automatic. Other options are Right, Left, Center, and Decimal. | ||||||||||||||||||||||
| Vertical Alignment |
Specifies the text vertical alignment in the column. The default is Automatic. Other options are Top, Middle, and Bottom. NOTE: This option can be used with a customized row height that is larger than the default. Typically, the row height is not much more than the text line height, and in that case, this option has minimal effect. |
||||||||||||||||||||||
| Format | Defines the text format. For more information, see Formatting Numeric Values. The default is Automatic. This option accepts macros. | ||||||||||||||||||||||
| Style Column |
Allows you to select a data column that has style settings that you want to apply to the column in the portlet instance. Values in the style column can contain the following style properties::
Each data value in the column can contain multiple comma-separated styles. For example, ValueFormat="0.000",Color="86,141,102",Justification="Center" |
||||||||||||||||||||||
|
Color Settings Applies to text indicator columns. See also Coloring a Text Indicator Column in a Measures Portlet |
|||||||||||||||||||||||
| Color Column | Specifies an alternate summary column that is used for exception coloring. | ||||||||||||||||||||||
| Time Range (Basic) |
|
||||||||||||||||||||||
|
|
Opens the time series mode settings box. Options are Basic and Advanced. | ||||||||||||||||||||||
| Advanced time series settings |
|
||||||||||||||||||||||
 if you want to select a different indicator type,
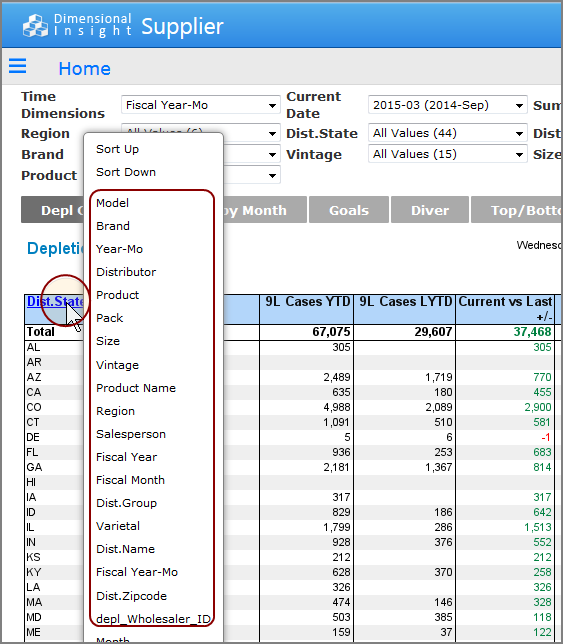
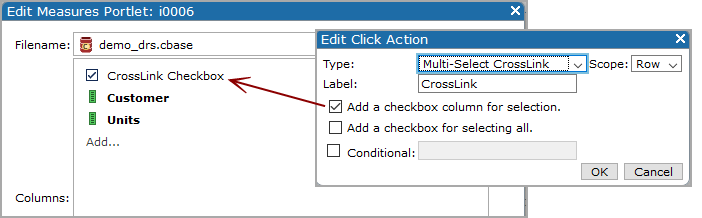
NOTE: The edit measures portlet wizard indicates that a check box column is added to the portlet when you add a crosslink click action with the option to add a check box for column selection.
See also: