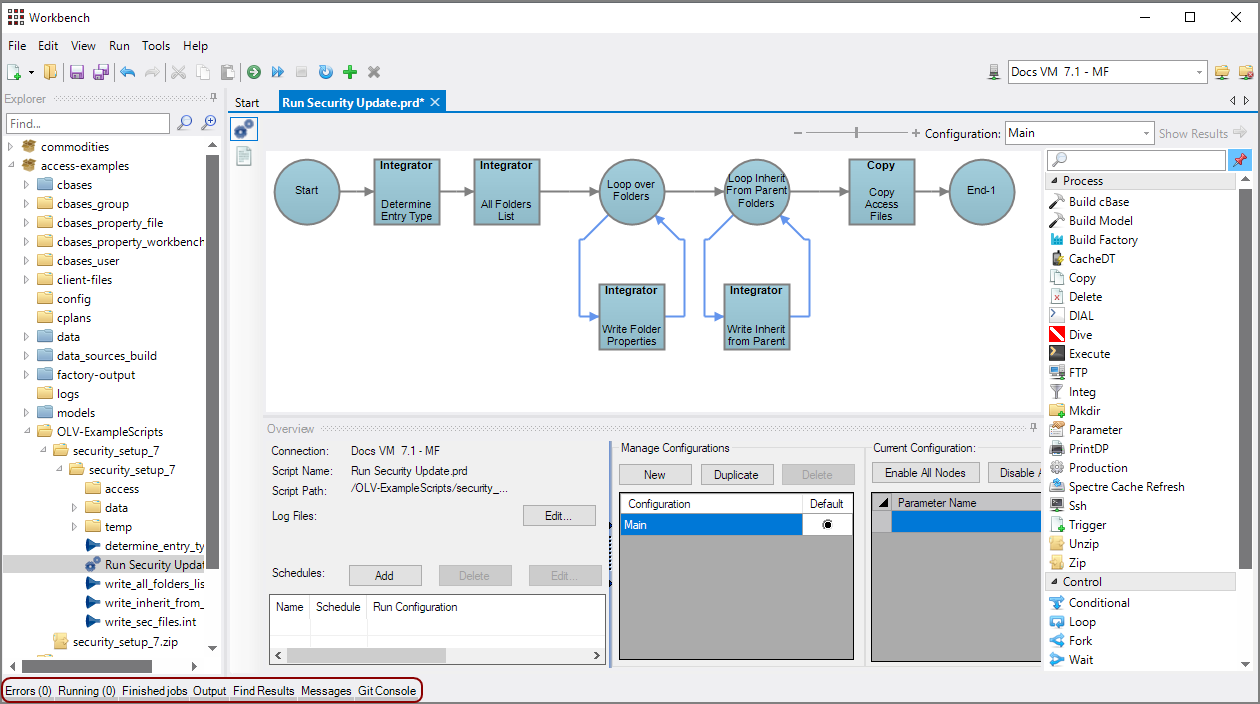
The Status Bar at the bottom of Workbench is an informational tool window for the current connection.

If any items exist in the Errors or Running sub-tab, a parenthetical number appears to the right of the label.
The Status Bar tool window is collapsed by default. As with the other tool windows, you can expand and pin the Status Bar open when necessary
The following shows examples of the status bar sub-tabs:
The Errors sub-tab displays any errors during the current Workbench session. You can double-click a row and the file opens with focus at the error point.

The Running sub-tab displays a list of any running scripts. It can show tasks on multiple servers, but only things you have requested. You can view the progress as well as pause, resume, and cancel a task.

The Finished jobs sub-tab displays all the scripts that ran during the current Workbench session.
You can double-click a row to open the Output sub-tab for that script or right-click to see a ![]() context menu.
context menu.

The Output sub-tab displays the output for the most recent script. You can use the drop-down list to view the output of any script that ran during the current Workbench session.

The Find Results sub-tab shows all of the search results from a search using the Find in Files feature (Edit > Find In Files). You can double-click a result to open the file containing the search term.

The Messages sub-tab, added in Workbench 7.1(9), shows any fatal RPC error messages to help diagnose connection problems.

The Git Console sub-tab, added in Workbench 7.1(16), opens a command console for advanced Git users. This tab only displays for DiveLine Administrators in an open connection.

