About
Map Portlets
Example
Optionally,
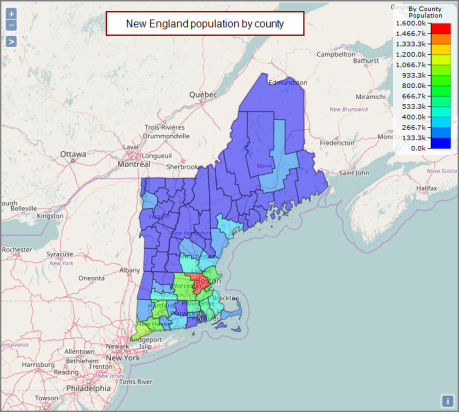
DivePort can display data as boundary maps, point maps, heat maps,
- Boundary maps use country, province, state, county, or postal code data. Predefined regions of the map are color-coded according to the data summarized over a region.
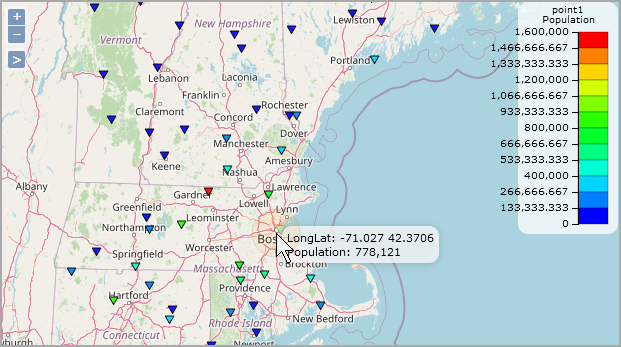
- Point maps use longitude and latitude coordinates to show data points. Summarized data concentration is shown using color or sizing of the data points.
- Heat maps use longitude and latitude coordinates to show data concentration using colors.
- Hexbin maps use longitude and latitude coordinates to show data concentration using colored hexagons.
- Line maps use longitude and latitude coordinates to show origin-destination data by drawing lines on a map.
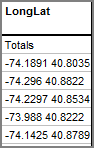
NOTE: Column data that contains longitude and latitude coordinates must be formatted as <longitude> <latitude> and the dimension name must be longlat. For example:
Placing the pointer on a map opens a ![]() tooltip that shows details about the specific location and data value.
tooltip that shows details about the specific location and data value.
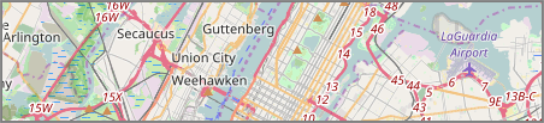
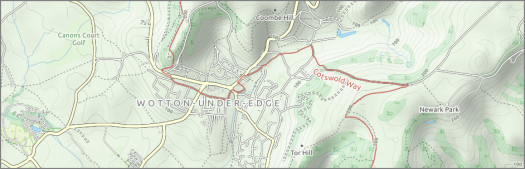
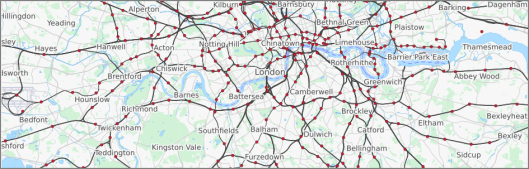
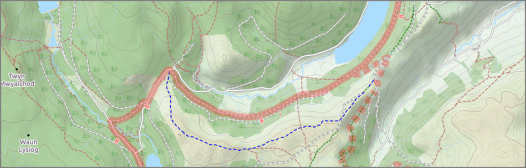
Map Portlet Base Layer
The map portlet base layer is the map itself. You can select one of the following sources for your base layer:
In addition, you can create your own custom GeoJSON file using a browser-based tool such as geojson.io. Each polygon in your custom geoJSON file must have a property that serves as a unique identifier for that polygon and the DivePort source data for the map must have a column that contains the polygon identifiers. Save your custom GeoJSON files in the \webdata\<diveport>\customizations\map-data folder to ensure that it appears as a ![]() geometry source in the edit map portlet wizard.
geometry source in the edit map portlet wizard.
NOTE: The use of Thunderforest base layers requires a Thunderforest API key. For more information, go to:
http://www.thunderforest.com/docs/apikeys/
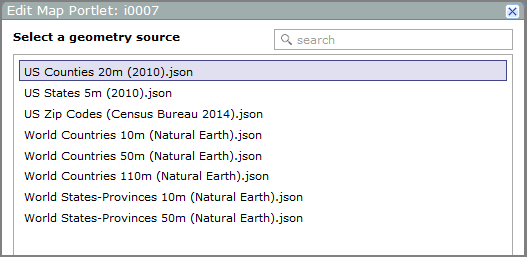
The following maps are included in DivePort internally, and are available options as a geometry source in the map portlet configuration wizard:
- US Counties 20m (2010)
- US States 5m (2010)
- US Three Digit Zip Code Prefixes (2014).json
- US Zip Codes (Census Bureau 2014)
- World Countries 10m (Natural Earth)
- World Countries 50m (Natural Earth)
- World Countries 110m (Natural Earth)
- World States-Provinces 10m (Natural Earth)
- World States-Provinces 50m (Natural Earth - Canada and US only)
For more information about these public domain world maps, see www.naturalearthdata.com.
During an upgrade, in order for DivePort to be able to replace the map_data.dat file in the webdata directory, which is a local cache of map data downloaded from DiveLine, Tomcat must have permission to delete that file.