About Chart Portlets
You can enable chart animation at the environment or portal level. When enabled, the rendering of charts is animated, typically from left to right. For more information, see
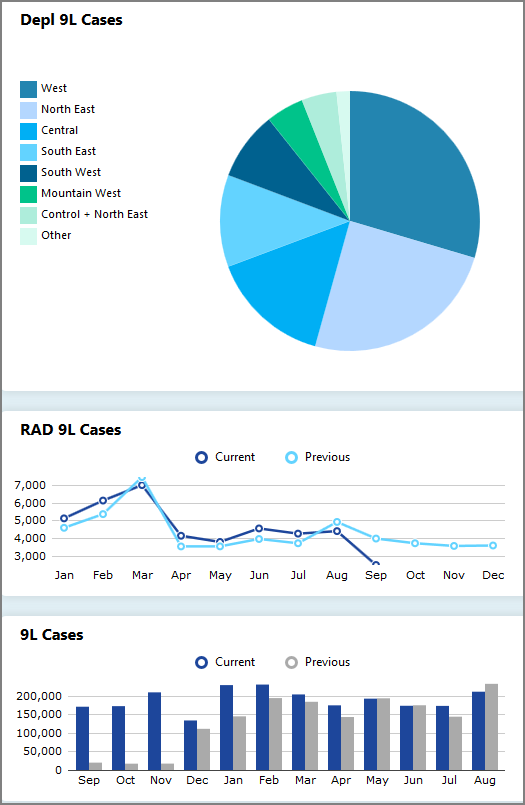
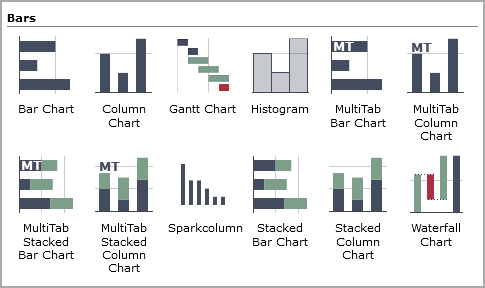
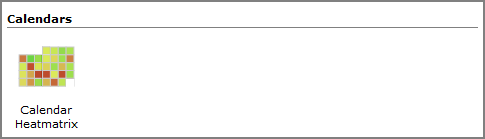
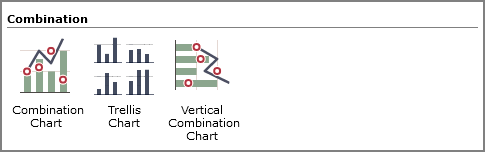
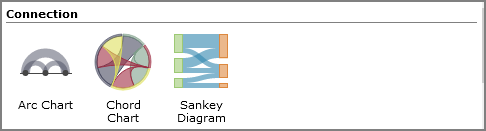
Examples of different types of chart portlets:
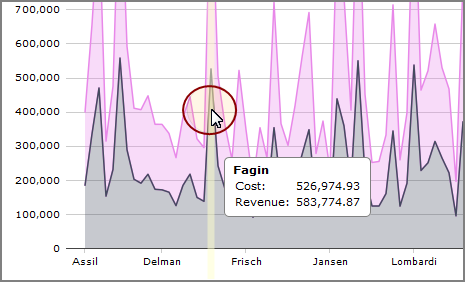
Placing the pointer on a point on the chart portlet displays detailed data in a ![]() tooltip format.
tooltip format.
Optionally, ![]() numeric data values.
numeric data values.
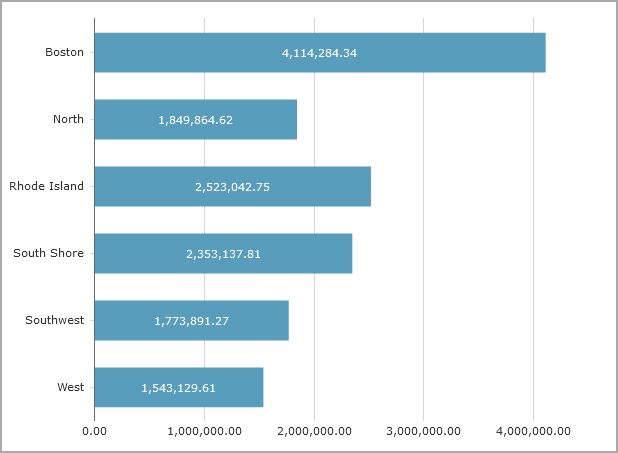
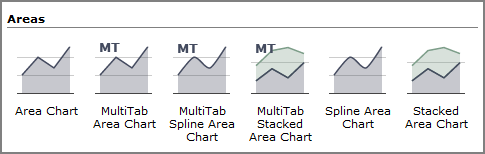
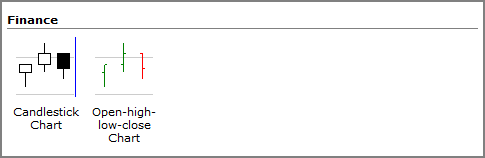
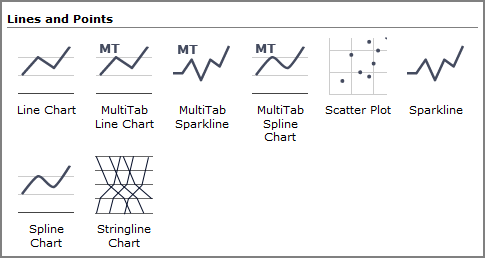
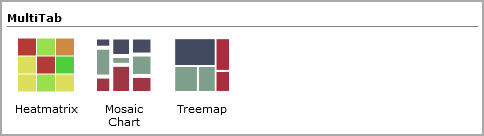
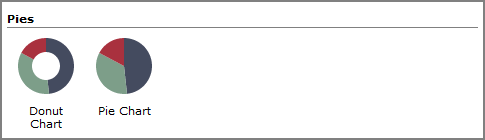
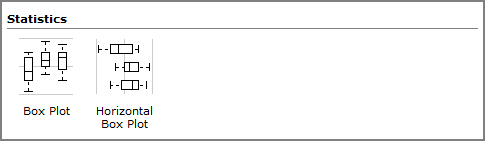
Chart types
You can create the following types of charts:
TIP: Charts do not render if they cannot fit in the space provided. If this occurs, increase the width of the chart portlet.
See also Charts.