About Gantt
A Gantt chart is a horizontal bar chart that is used specifically to show a project schedule, status, and task dependencies.

-
The vertical axis shows project tasks.
-
The horizontal axis shows the project timeline.
-
The width of the bars show the duration of each task.
-
Colors indicate a category to which a task is assigned.
-
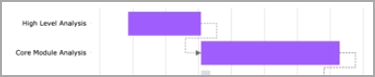
Arrows can be drawn between bars to indicate dependencies. In this example, the arrow indicates that High Level Analysis must be complete before Core Module Analysis can begin.
For more information, see: