Creating a Gantt Chart
Every gantt chart requires the following dimensions:
-
A dimension with task data.
-
A dimension with task Start dates.
-
An dimension with task End dates.
Additionally, it is recommended that a gantt chart have a dimension with categories for each task, and a dimension containing dependency values. An example table is below:
| Category | Task | Planned Start | Planned End | Dependent On |
|---|---|---|---|---|
| Contracts | Bid Date | 01/28/2023 | 01/29/2023 | |
| Contracts | Award Processing | 01/29/2023 | 02/15/2023 | Bid Date |
| Design | Feasibility Study | 01/30/2023 | 02/03/2023 | |
| Design | Apply for Permits | 02/07/2023 | 02/12/2023 | Feasibility Study |
- In DivePort, browse to the page where you want to add the portlet.
-
On the DivePort toolbar, click Edit to unlock the page and enable edit mode.
The Edit menu item is replaced with edit tools, including a page context menu chevron.
- On the toolbar, click the chevron.
- On the page context menu, click Add a Portlet.
-
On the Add Portlet page,
The Edit Chart Portlet, Select a data source
 page opens. This is the first page of a portlet creation wizard.
 -
From the Project list, select a data source, and then click Next.
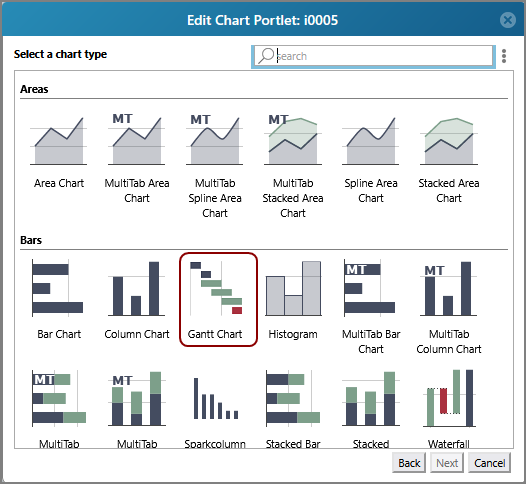
The Select a chart type
dialog box opens, showing a gallery of available chart types. -
Select Gantt Chart, and then click Next.
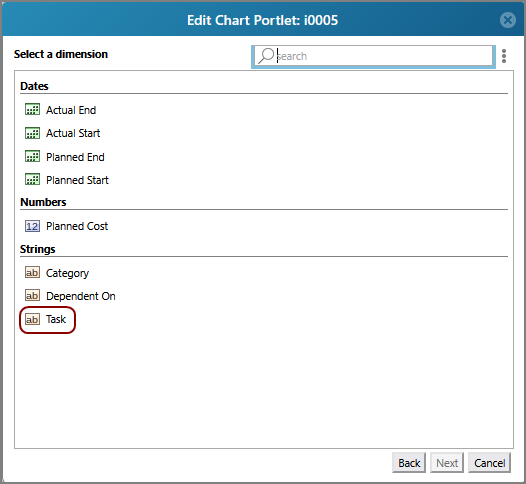
The Select a dimension
page opens. -
Select the dimension that contains task values, then click Next.
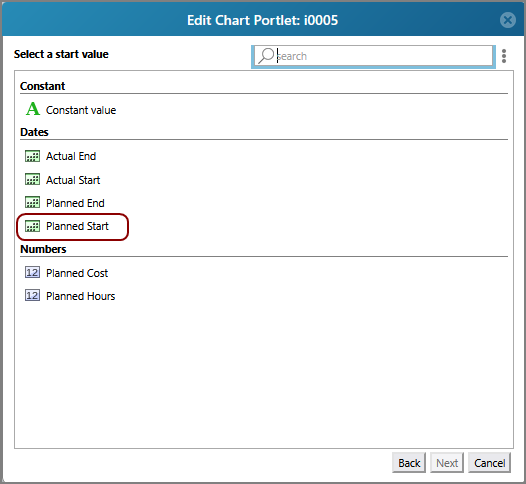
The Select a start value
page opens. -
Select the dimension that contains starting date values for each task, then click Next.
The Select an end value
page opens. -
Select the dimension that contains ending date values for each task, then click Next.
The Edit Chart Portlet
main page opens, displaying your selections. -
Under More Settings, click Colors.
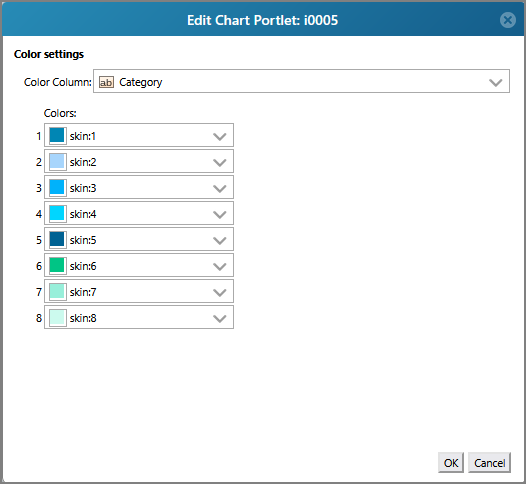
The Color settings
page opens. -
Select a column that contains category values for each task. You can also select different colors for each category than the provided defaults.
TIP: A color column is recommended for organizing tasks into more easily recognizable sections. If the color column is not set, every item in the chart is colored according to the first color set in the Color settings and the legend is inaccessible.
-
Click OK.
-
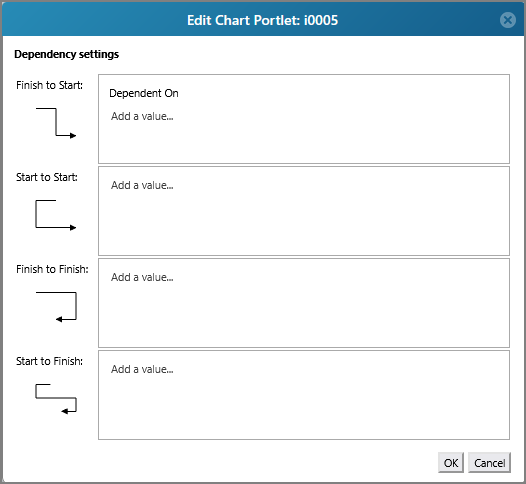
Under More Settings, click Dependencies.
The Dependency settings
page opens. -
Choose a dependency type, then select a dimension that contains dependency values.
NOTE: Each row of data can only be dependent on one other row.
-
Click OK.
-
On the Edit Chart Portlet page, click OK to exit edit mode and save the new gantt chart.


A gantt chart with no colors, legend, or dependencies looks like this:

A gantt chart with colors, a legend, and dependencies looks like this:
