Dimensional Insight Data Analysis Finds Democrats 44% More Likely to Consume Wine than Republicans
Republicans 13% More Likely to Consume Beer than Democrats
Press Release
November 7, 2016
Media Contact:
Kathy Sucich at Dimensional Insight
781.419.2145
[email protected]
Burlington, Mass. – November 7, 2016 – Dimensional Insight, a developer of business intelligence (BI) solutions for highly regulated industries, today announced that it has conducted a data analysis that shows Democrats are 44% more likely than Republicans to drink wine and Republicans are 13% more likely than Democrats to drink beer. The analysis also showed that with hard alcohol, there was not as great of a difference, with Democrats just 7% more likely than Republicans to consume spirits.
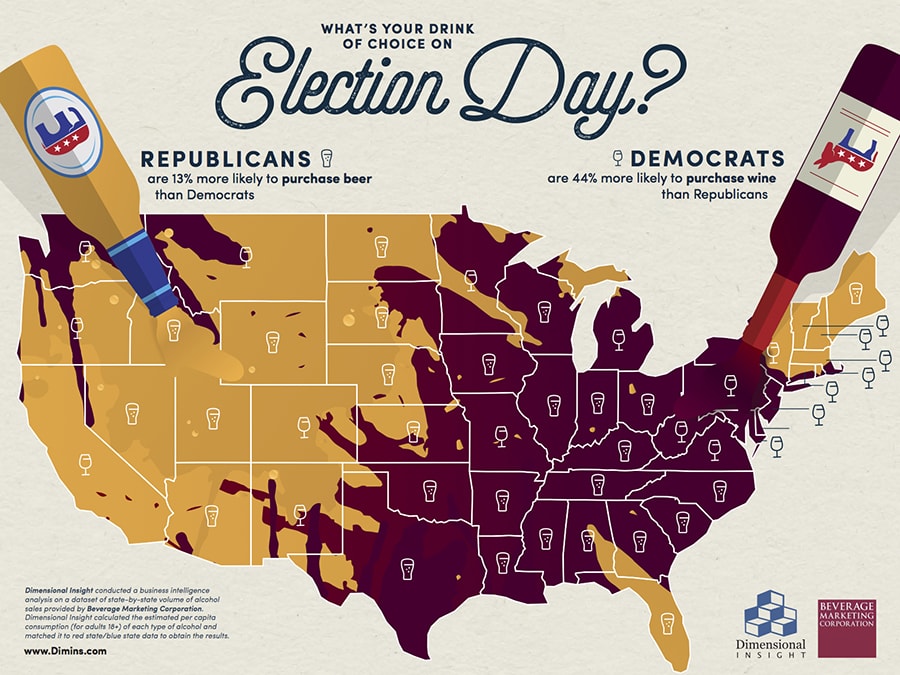
To conduct the analysis, Dimensional Insight imported the following data into Diver Platform, the company’s business intelligence platform:
- A data set from Beverage Marketing Corporation’s DrinkTell database that included a state by state breakdown of total volume of beer, wine, and spirits sold for the years 2012-2014 (the last year for which a full data set is available).
- U.S. Census population estimates on the number of adults (18+) living in each state in 2014.
- “Red” state and “blue” state information. A variety of factors determine a state’s color, including governorship, state and federal elected officials, and historical voting preferences.
Once all of the data was imported into Diver, Dimensional Insight converted the alcohol volume figures into a common unit of measurement (liters) and calculated a per capita consumption rate for beer, wine, and spirits in each state.
An analysis of the data found that the per capita consumption of wine in red states in 2014 was 10.77 liters and in blue states was 15.46 liters (44% more). For beer, the per capita consumption for blue states was 92.50 liters, and the per capita consumption of beer in red states was 104.45 liters (13% more). For spirits, red states’ per capita consumption was 7.51 liters and blue states’ consumption was 8.04 liters (7% more).
To learn more about the data analysis, please visit: “What’s Your Drink of Choice on Election Day?
About Dimensional Insight
Dimensional Insight is a leading provider of business intelligence (BI) solutions. The company offers a complete portfolio of BI capabilities ranging from data integration and modeling to sophisticated reporting, analytics, and dashboards. Founded in 1989, Dimensional Insight has thousands of customer organizations worldwide. Dimensional Insight’s Diver Platform™ consistently ranks as a top performing business intelligence platform by customers and industry analysts in its core market segments including healthcare, manufacturing and beverage alcohol industries. For more information, please visit https://www.dimins.com.