The Measure Factory configuration file is comprised of several sections outlined in Factory Configuration File Overview. Prior to Diver Platform 7.1, you worked on these sections within the factory configuration script using a text editor. In Workbench 7.1, you can use the Measure Factory Editor when working with measures, rules, and data sets.
NOTE: The Measure Factory Editor can edit factory scripts connected to DiveLine 7.0(49) and later. Connecting to a DiveLine server 7.0(48) or earlier displays the factory script in text view.
When you open a factory configuration file, the initial screen for the Measure Factory Editor displays the Measures page.

Double click a row to see details about the measure in the detail pane on the right, or click any underlined, colored item in the table to see more information about that component. If that component is not a rule, another measure, or a data set, it opens the text editor view with focus on the line for that item.
To display the ![]() Rules page, at the top of the Measures page, click Rules.
Rules page, at the top of the Measures page, click Rules.

To display the ![]() Data Sets page, click Data Sets.
Data Sets page, click Data Sets.

TIP: The Measure Factory Editor screens contain a lot of information. To make the information easier to read, consider the following:
-
Unpin the Explorer to make more room for the main table display.
-
Drag the dividers in the heading row on the Measures and Rules pages to resize the columns.
-
Right-click the table header to open the Select Columns dialog box where you can filter the columns displayed.
-
Limit what displays in the rules or measures tables:
- Use the search box to filter what displays in the table.
-
Use the Group by buttons to group the measures or rules. Your choice is reflected in the first column and affects how the rows are ordered.
-
Use the Show only buttons on the rules tab to selectively show only one or more rule types.
On the Measures or Rules page, double-click a measure or rule row to view its details on the right pane. Note the key icons and color coding.
Measures are indicated by a geometry compass icon ![]() and are shaded blue.
and are shaded blue.

Rules are indicated by a rule icon that varies, depending on the rule type, and are shaded green.
![]()
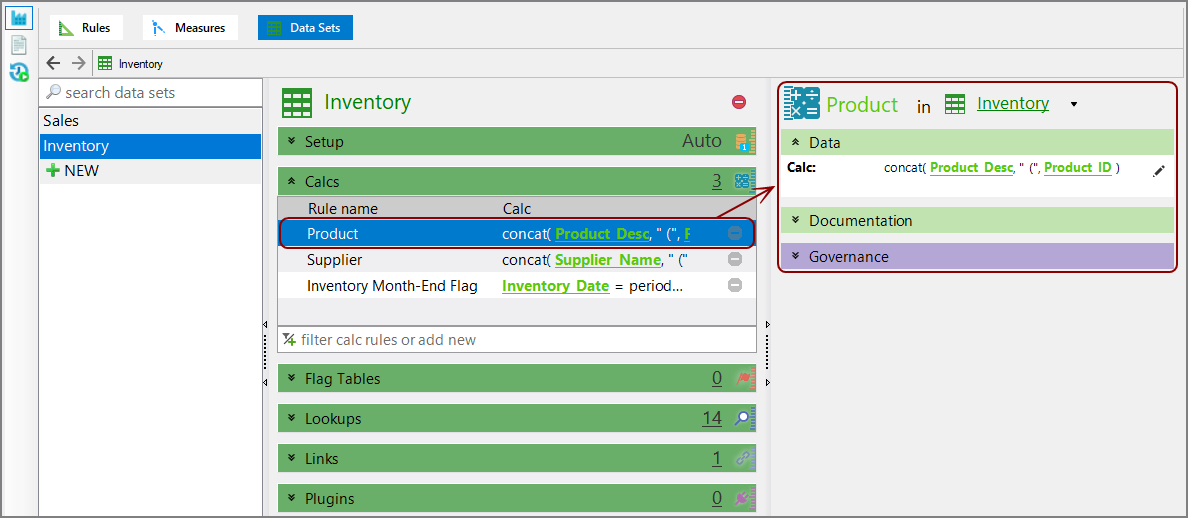
On the Data Sets page, double click a row in the center pane to view information about the data type in the right pane.
From the detail pane of either a measure or rule, you can click the View in script icon ![]() , at the lower left of the pane to open the text editor view with focus on the line where this measure or rule is defined.
, at the lower left of the pane to open the text editor view with focus on the line where this measure or rule is defined.
You can use the ![]() view switcher at the upper left to switch between the Measure Factory Editor and Text Editor views. The third icon in the view switcher is for examining the Run History.
view switcher at the upper left to switch between the Measure Factory Editor and Text Editor views. The third icon in the view switcher is for examining the Run History.

You can use the ![]() Run button to run the factory configuration file, or you can use the down arrow next to the button to run a test on a specific data set.
Run button to run the factory configuration file, or you can use the down arrow next to the button to run a test on a specific data set.
