A DiveTab cross page draws information from a cPlan and presents data from two dimensions. Both dimensions share the same summary data. The first dimension displays vertically in the first column with its values as row headings, and the cross-dimension displays horizontally in the first row with its values as column headings.
In the following example, the Premise dimension values (OFF PREMISE, ON PREMISE, OTHER NON RETAIL, and TRANSPORTATION) display as row labels, while the Resp Team cross-dimension values (Crowe, Gampie, Gorman, Higbee, and Holgate) display as column headings. The summaries appear as a stacked column (Cases, Cost, and Net Sales) associated with the dimension values. Summary values intersect both dimension and cross-dimension values.
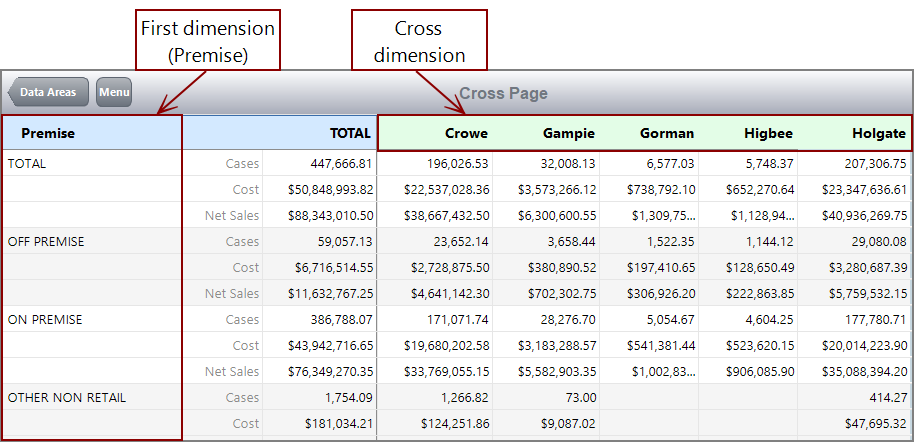
Cross pages include the total for each summary value. These totals are then subdivided into totals for each dimension and cross dimension.
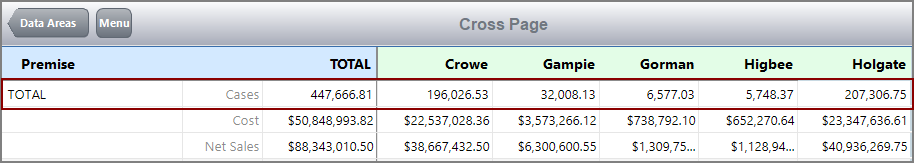
In this example, the TOTAL column contains the combined values from the cross dimension values in the row. For example, the total number of cases sold (447,666.81) equals the sum of the cases sold by each team member (196,026.53 + 32,008.13 + 6577.03 + 5748.37 + 207,306.75).
And the TOTAL row contains the combined values of the dimension values in that column. For example, the total number of cases sold (447,666.81) equals the sum of the cases sold to each premise type (59,057.13 + 368,788.07 + 1,754.09 + 67.52).
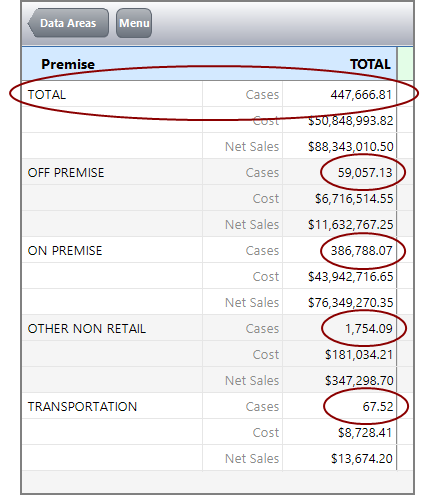
Moving horizontally, the TOTAL then applies to individual Resp Team values. Moving vertically, the TOTAL applies to individual Premise values for all Resp Team values.
Here is the ![]() sample cross page as it appears in DiveTab.
sample cross page as it appears in DiveTab.

In this example, you can see how two dimensions interact and relate to each other and the main body shows summary values that pertain to both dimensions.
Here is how the ![]() cross page example looks in the script.
cross page example looks in the script.
By changing the cross-dimension to a dimension, you can see what the sample cross page looks like as a report page.
Here is ![]() the code for the above cross page as a report page.
the code for the above cross page as a report page.
NOTE: Cross pages require both a dimension and a cross-dimension.
Here is the ![]() result in DiveTab.
result in DiveTab.

Here is the same ![]() cross page showing the context menus for the dimension and TOTAL column, as well as a cross dimension column.
cross page showing the context menus for the dimension and TOTAL column, as well as a cross dimension column.

NOTE: You can view only one context menu at a time.
Here is how the same ![]() cross page looks with the cross dimension Gorman sorted down on cases.
cross page looks with the cross dimension Gorman sorted down on cases.

The main dimension column is sorted alphabetically by the dimension value. The TOTAL and cross dimensions columns are sorted by one of the summary types.