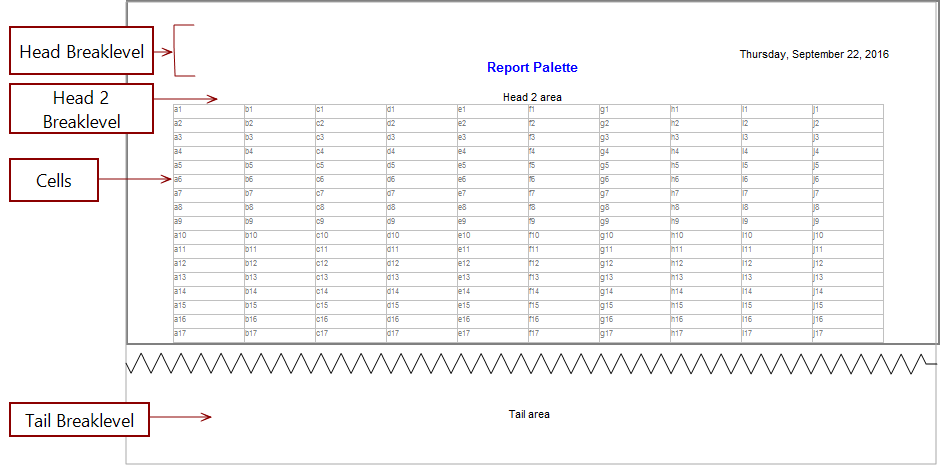
Report palettes have a cell grid and three breaklevel areas. Initially, the cell area is populated with 40 rows and 10 columns, and the head breaklevel displays Report Palette in the top center and the current date in the top right. The other two breaklevels (head 2 and tail) are blank by default, but appear in this ![]() example to show their placement.
example to show their placement.
When you create a report palette, a locked default view opens.
To unlock the report, click the Unlock icon ![]() located on the top left of the dive window.
located on the top left of the dive window.
When the report is unlocked, the editing tools appear on the toolbar, and the cell grid appears. These editing tools are the same as those on the report toolbar except that the report palette toolbar has an additional editing tool ![]() that you can use to add graphs and images.
that you can use to add graphs and images.