ProDiver Graph Formats
You can view your data in various graphical formats. The best type of graph to use depends on the data being presented.
Basic Plot Graphs
Basic plot graphs display data for a single dimension and up to 16 summaries. They consist of a series of plotted points that correspond to summary values being displayed. Basic plot graphs include bar graphs, line graphs, and point graphs. The following styles of basic plot graphs are available:
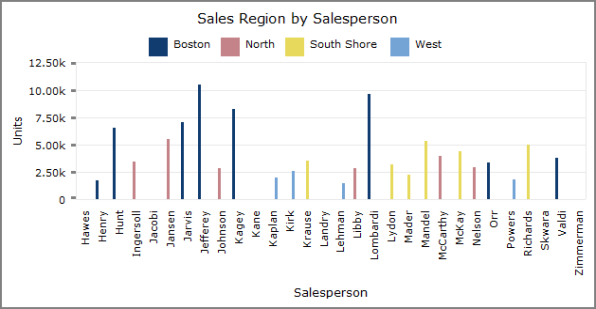
Bar Plot Graph ![]() Example
Example

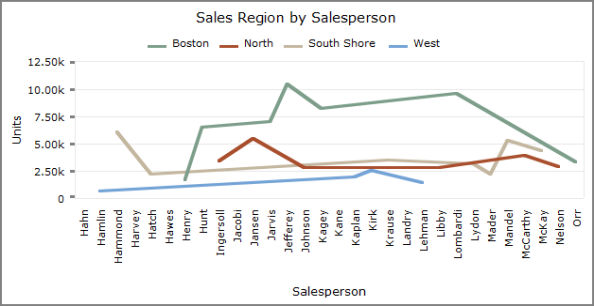
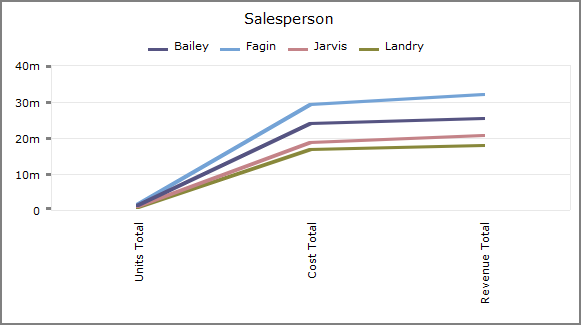
Line Plot Graph ![]() Example
Example

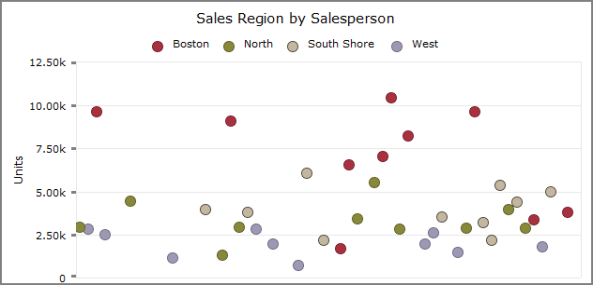
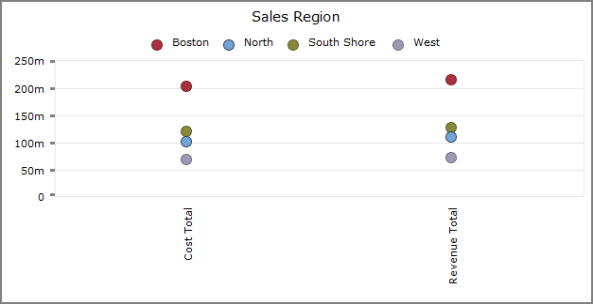
Point Plot Graph ![]() Example
Example

Area Plot Graph ![]() Example
Example

Spline Plot Graph ![]() Example
Example

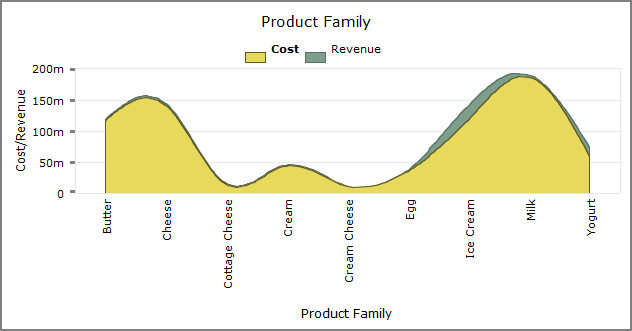
Area Spline Plot Graph ![]() Example
Example
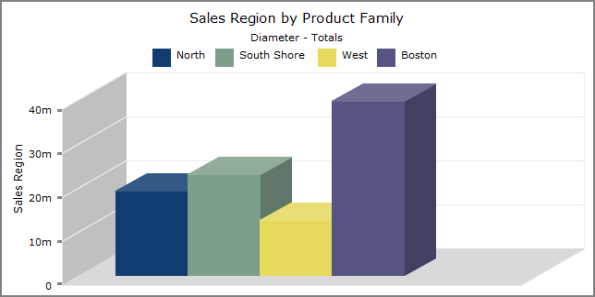
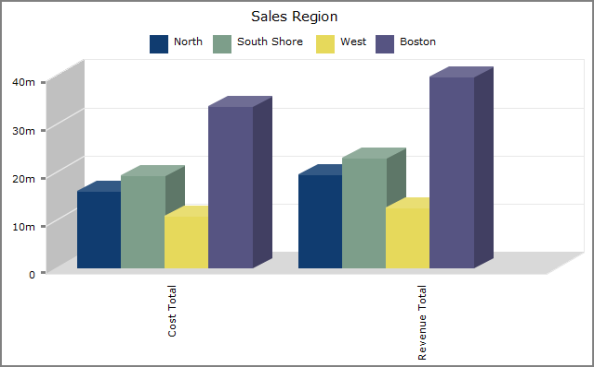
3-D Bar Plot Graph ![]() Example
Example

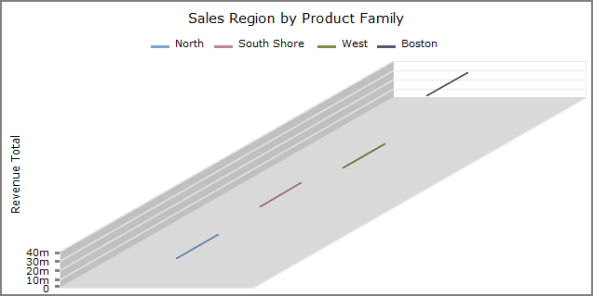
3-D Line Plot Graph ![]() Example
Example

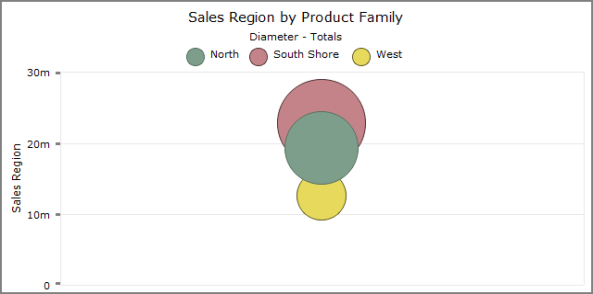
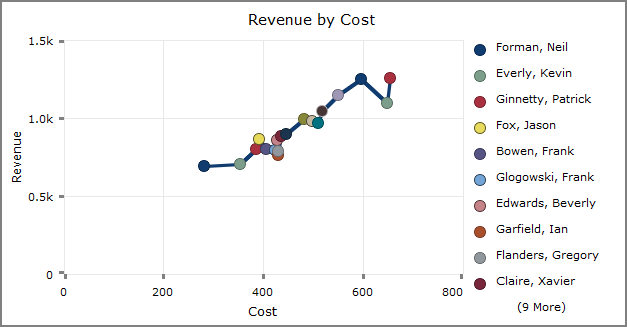
Linear Bubble Graph ![]() Example
Example

Pie Plot Graphs
Pie plot graphs display up to 16 values for a single dimension. If there are more than 16 values, the graph displays the first 15 values listed in the tabular display, and combines the remaining values in a 16th wedge called Other. The following styles of pie
Pie Plot Graph ![]() Example
Example

3-D Pie Plot Graph ![]() Example
Example

Doughnut Plot Graph ![]() Example
Example

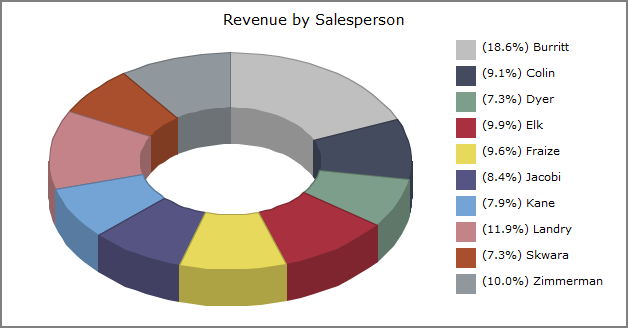
3-D Doughnut Plot Graph ![]() Example
Example
Calendar Plot Graphs
Calendar plot graphs display data for up to 16 summaries in calendar format. The dive dimension must be a date. The following styles of calendar plot graphs are available:
-
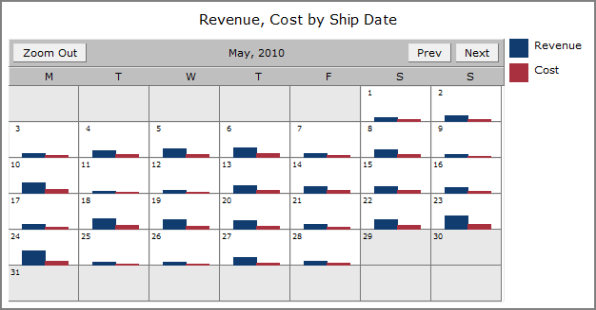
Calendar View with Bar Plots—Shows a bar (or point) representing the relative size of summary data on each day of the calendar
 Example
 -
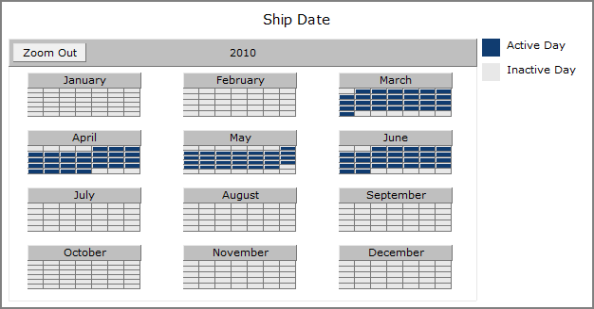
Calendar Active View—Shows whether or not summary data is available for each day
Example -
Calendar Sorted View—Shows color-coded data that indicates a range of values
Example

Cross Plot Graphs
Cross plot graphs shows data that pertains to two dimensions simultaneously. The following styles of cross plot graphs are available:
-
Bar Cross Plot
Example -
Line Cross Plot
ExampleNOTE: If there is only one value, instead of a line, the graph displays a dot.
-
Point Cross Plot
Example -
Bar Summary Cross Plot
Example -
Line Summary Cross Plot
Example -
Point Summary Cross Plot
Example -
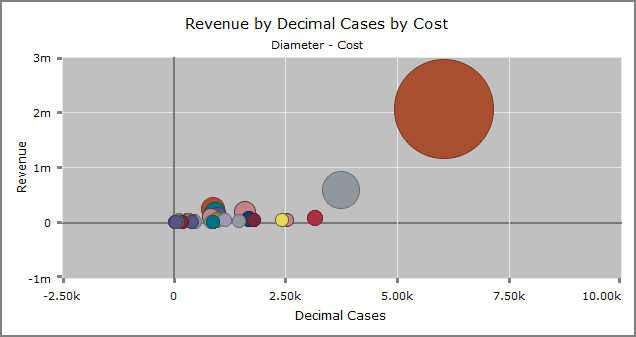
Bubble Cross Plot
Example -
3-D Bar Cross Plot
Example -
3-D Line Cross Plot
Example -
3-D Bar Summary Cross Plot
Example -
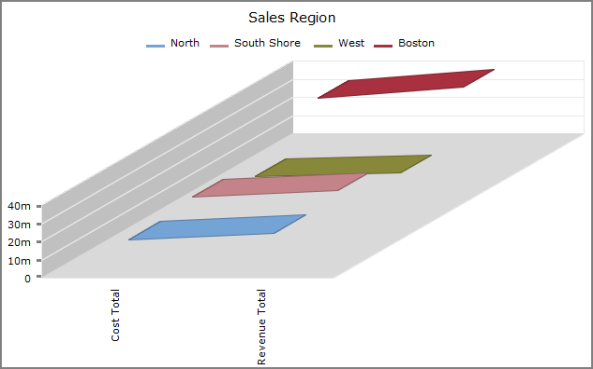
3-D Line Summary Cross Plot
Example
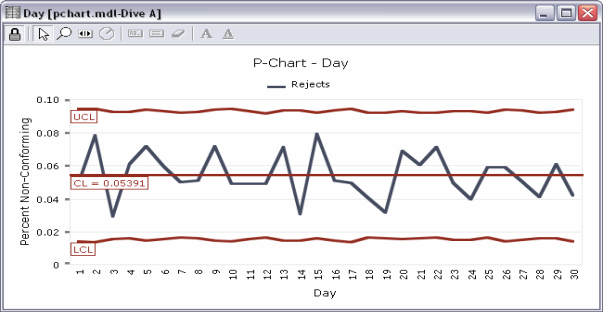
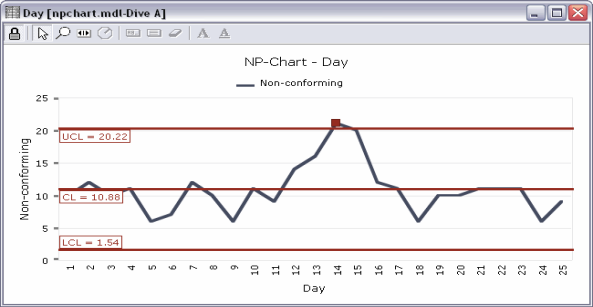
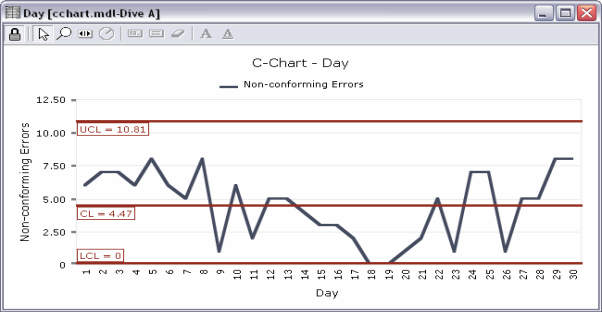
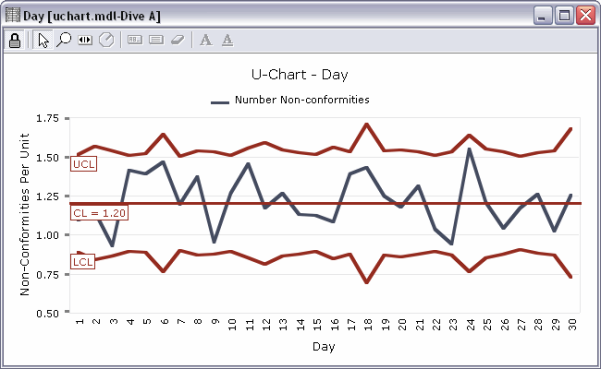
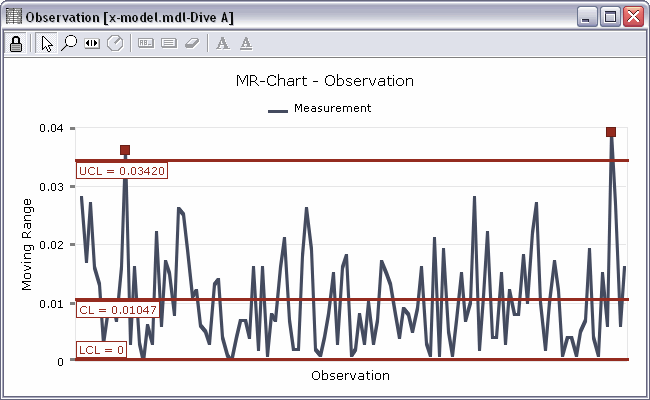
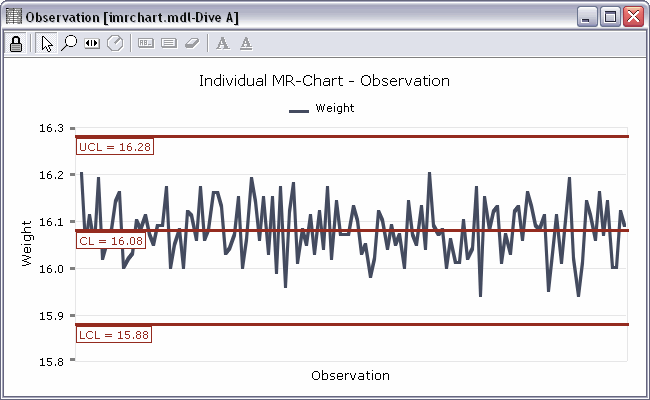
Control Chart Graphs
Control chart graphs show statistical background data for a single dimension. They can be used to observe trends. The following styles of control chart graphs are available:
-
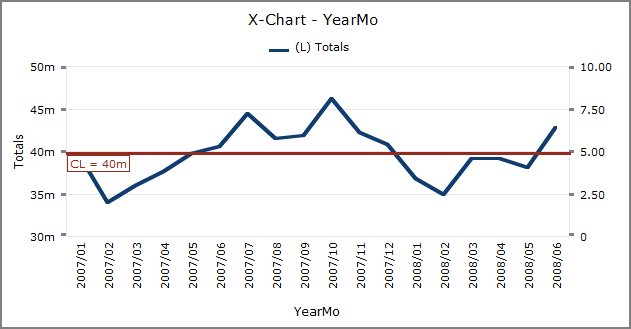
X-Chart
Example -
P-Chart
Example -
NP-Chart
Example -
C-Chart
Example -
U-Chart
Example -
MR-Chart
Example -
Individual MR-Chart
Example - Custom Data Control Chart
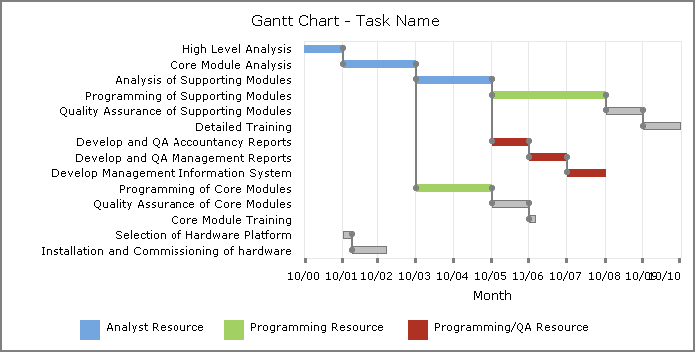
Time Graphs
Time Graphs show linear bars that represent a range of time. ProDiver displays Gantt charts. ![]() Example
Example
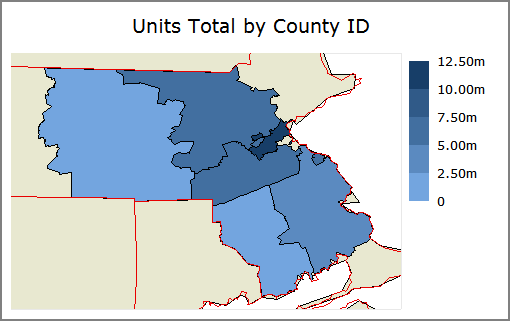
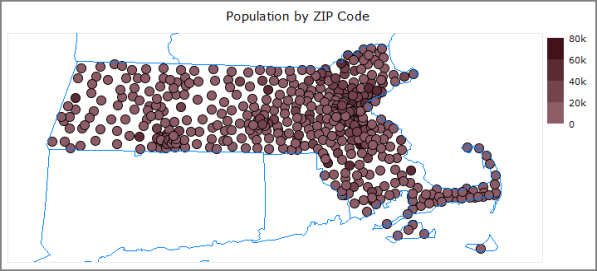
Map Graphs
Map graphs show data over a geographical area. A developer must set up a map folder and geographical attributes in order for map graphs to be created. The following styles of map graphs are available:
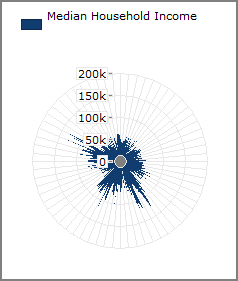
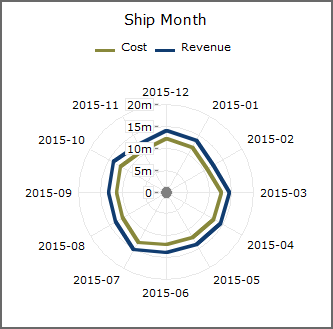
Radar Graphs
Radar graphs display summary values as radius points from a common central axis. The following styles of radar graphs are available:
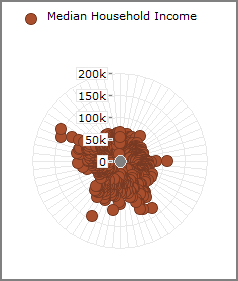
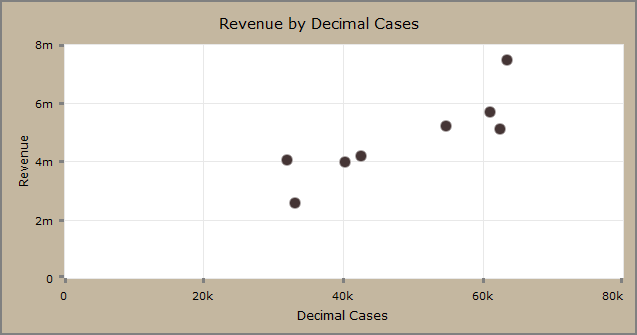
Scatter Plot Graphs
Scatter graphs display data for two summaries across a single dimension. The following styles of scatter graphs are available:
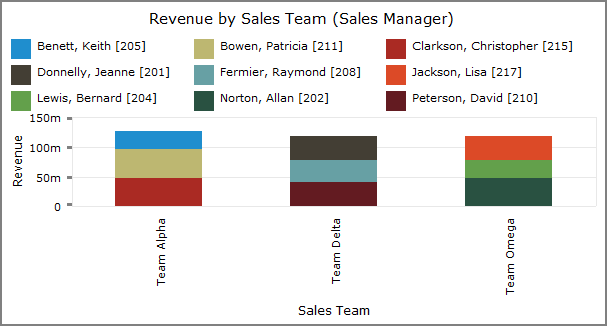
Stack Plot Graphs
Stack plot graphs display summary values in a stacked format. The following styles of stack plot graphs are available:
-
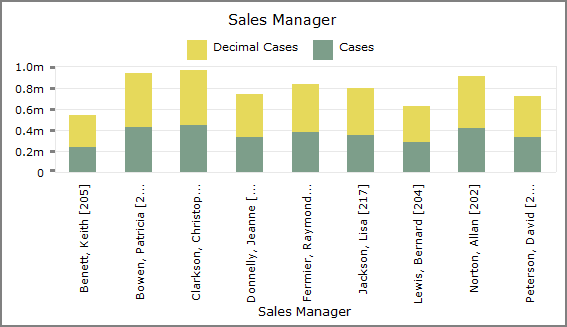
Bar Stack Plot
Example -
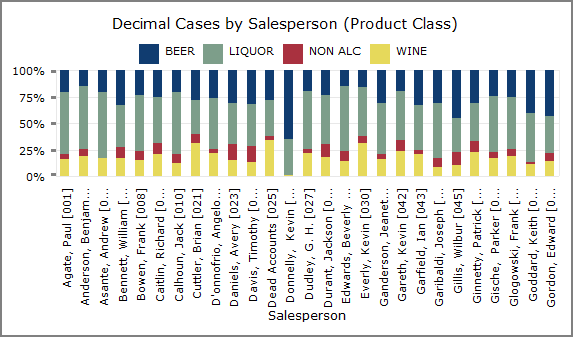
Percentage Stack Plot
Example -
Summary Stack Plot
Example -
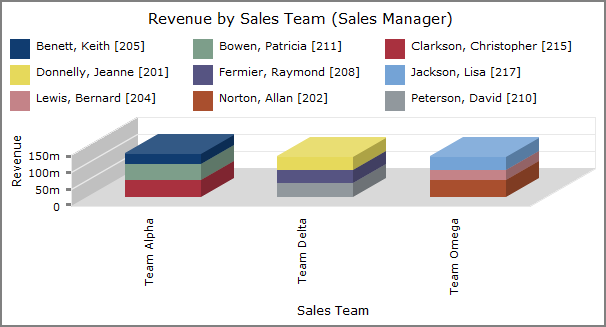
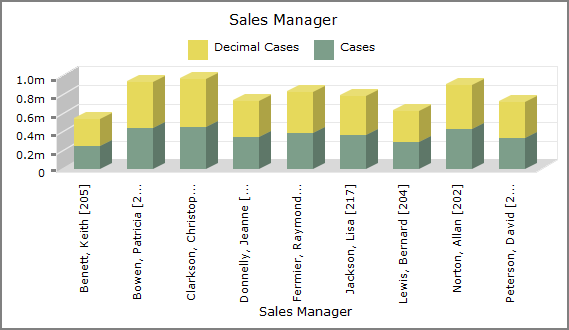
3-D Bar Stack Plot
Example -
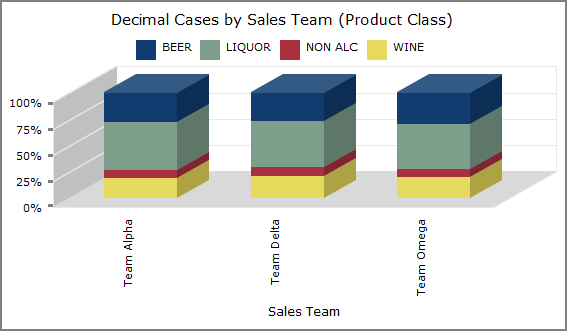
3-D Percentage Stack Plot
Example -
3-D Summary Stack Plot
Example
For more information, see About Graph Attributes.