ProDiver creates Gantt charts to illustrate project schedules and dependencies.
To convert the contents of an active dive window to a time graph:
-
On the toolbar, click the Graph icon
 .
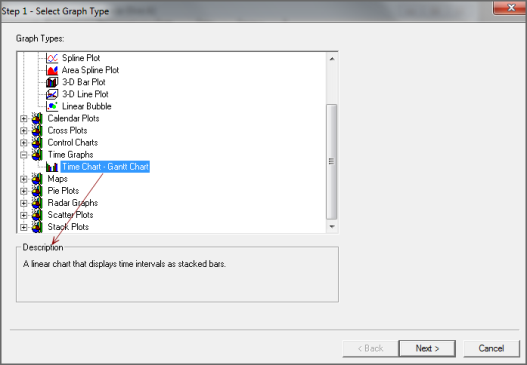
.The Select Graph Type
 dialog box opens. This is the first step in a graph creation wizard.
 TIP: Click a graph type to see a description in the Description box.
-
Double-click Time Chart - Gantt Chart.
The Set Data Attributes
dialog box opens. -
In the Task Start Column box, select a date or time-period column that represents the task start date or time period.
-
In the Task Finish Column box, select a date or time-period column that represents the task end date or time period.
-
Optional. In the Dependency Info Field box, select a column that lists task dependencies.
-
Optional. In the Legend Info Field box, select a column that lists task category labels (such as person assigned to the task).
This option assigns a color to each of the legend labels, and colors the graph bars accordingly.
-
If you want to further customize the graph, click Graph Options. Otherwise, click Finish to view the graph.

For more information, see Selecting Graph Options.