You can add data filters to a column to display more meaningful data. For example, if you are using a Sales Income DimCounts column, you could specify that the column shows the DimCounts for a particular region, or DimCounts for income above a specified threshold.
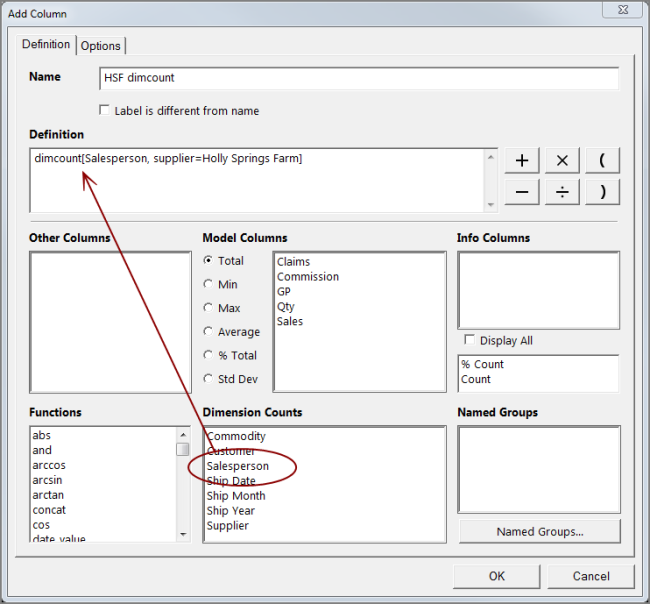
You can add data filters as arguments to the DimCount Column definition in the Add/Edit Column ![]() dialog box.
dialog box.
Syntax: dimcount [ <Dimension_name>, <Filter - Dive>, <Filter - Dive> ...]
Where: <Filter - Dive> is defined in one of these ways:
<Dimension_name = Dimension_value> — For example, Sales Team = Team Alpha
<Summary_column_definition comparison_symbol n> — For example, Total Units >= 1000
NOTE: With the model engine, you cannot use a dimcount expression as a predicate inside a filtered dimcount expression. For example, dimcount [Customer, dimcount [Order Date] > 1, Total [Units] >17] returns an error.
In this example, a
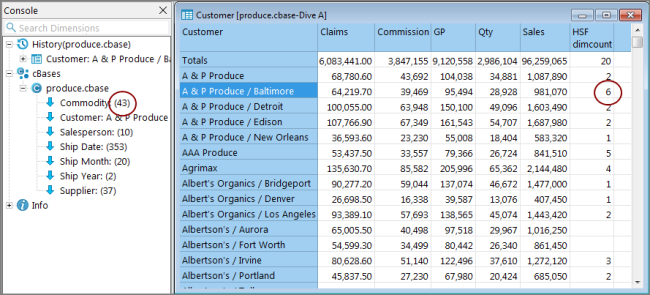
The Console shows that A&P Produce/Baltimore purchsed 43 types of commodities, and the HSF dimcount column shows that 6 of the 43 commodities were supplied by Holly Springs Farm.
NOTE: A comparison type of data filter can have only one dimension value. If you want to filter on a range of values, for example:
1000 < Total[Units] <= 2000
you can define a calculated field, such as:
InRange = AND(Total[Units] > 1000,Total[Units]<= 2000)
and use that field as the filter:
dimcount[Order Date,InRange > 0]
Spectre can manage filtered dimcounts using arbitrary filters. For example:
`filter( dimcount("OrderNbr"), value("DeliveryDate") = today() )`
If you add this type of filter to a cPlan, you can access this calculation in your markers. Although you can continue to use the traditional model calc language in markers and DivePlans against cBases, you can also enter individual calculations in the Spectre language. Enclose the expression in backticks (`) as shown above, when using the ProDiver Edit Column dialog box to edit it. Placing the calc into a cPlan might be more sensible, however, if it is convenient you can use this option instead.
For information about Spectre, see Workbench Help.