You can use the report palette Add Graph tool ![]() to generate spider graphs and insert images or indicators to a report palette.
to generate spider graphs and insert images or indicators to a report palette.
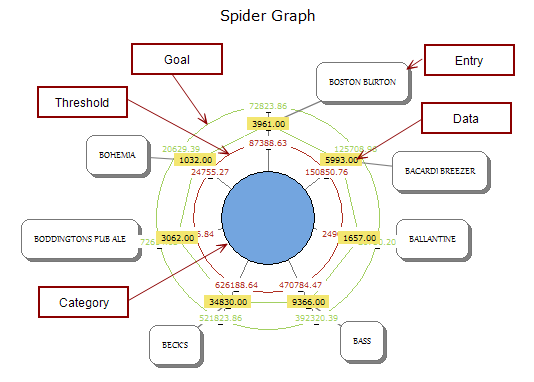
A ![]() spider graph is a chart that consists of a sequence of evenly-spaced spokes, with each spoke representing a variable (row). They can be used to display unrelated data because the data points are relative to the column threshold and goal values as opposed to each other. A line is drawn connecting the data values for each spoke. This gives the plot a spider web-like appearance.
spider graph is a chart that consists of a sequence of evenly-spaced spokes, with each spoke representing a variable (row). They can be used to display unrelated data because the data points are relative to the column threshold and goal values as opposed to each other. A line is drawn connecting the data values for each spoke. This gives the plot a spider web-like appearance.
Prior to creating a spider graph, you must define five columns in the report palette:
- Category—A group of related values.
- Entry—The specific item (or metric) name (the spoke label).
- Threshold—A minimum acceptable value. By default, data values below this level are colored red on the spider chart. This is not the minimum value in the scale.
-
Goal—A maximum value defining the expected range. By default, data values above this level are colored green on the spider chart. This is not the maximum value in the scale.
-
Data—The value of the metric. It is represented by a colored label on the spoke. By default, values between the threshold and goal are colored yellow.
To create a spider graph from a report palette:
-
Open and Unlock the report palette.
-
Verify that the palette has the required columns.
-
On the report palette toolbar, click the Add Graph icon
 .
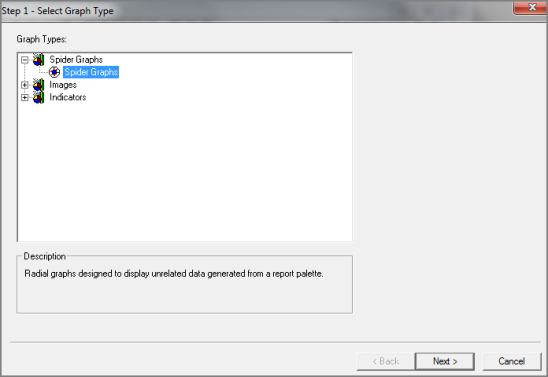
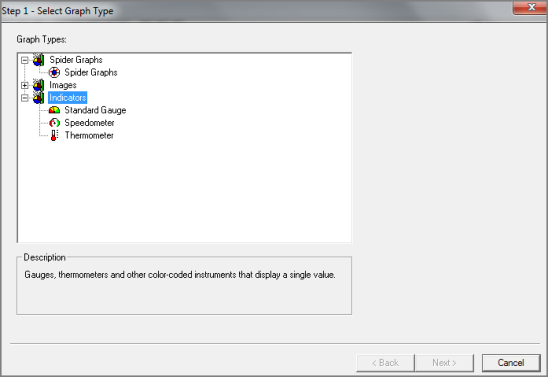
.The Select Graph Type
 dialog box opens. This is the first step in the graph creation wizard.
 -
Select Spider Graphs, and then click Next.
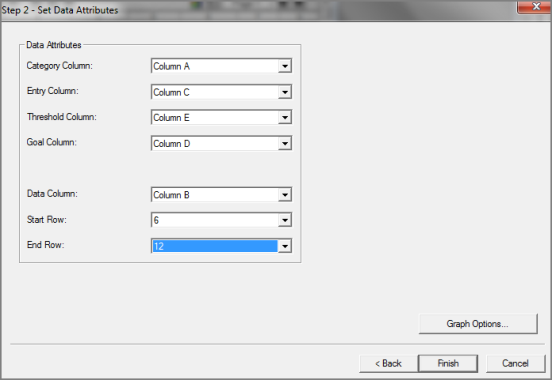
The Set Data Attributes
dialog box opens. -
Select the Category Column, Entry Column, Threshold Column, Goal Column, and Data Column.
-
Enter a span of rows that you want to include on the graph using the Start Row and End Row lists.
-
If you want to further customize the graph, click Graph Options. Otherwise, click Finish to view the graph. For more information, see Selecting Graph Options.
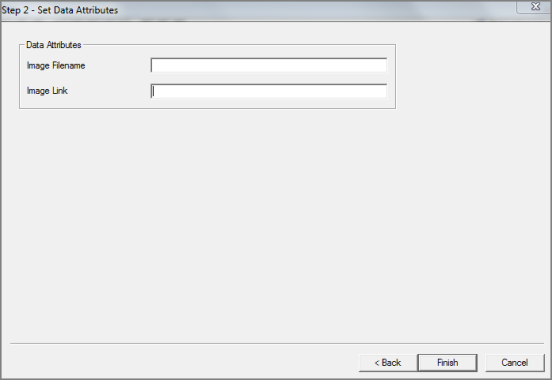
You can insert png, jpeg,
To insert an image in a report palette:
-
Open and Unlock the report palette.
-
On the report palette toolbar, click the Add Graph icon
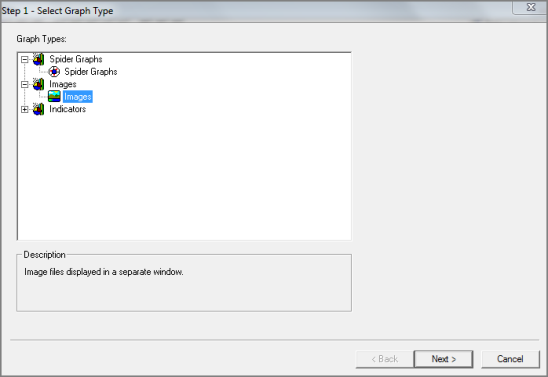
.The Select Graph Type
dialog box opens. This is the first step in the graph creation wizard. -
Select Images, and then click Next.
The Set Data Attributes
dialog box opens. -
Enter an Image Filename and in the Image Link box, enter a link to a Window reference, URL, or file, and then click Finish.
-
To reposition the image:
- Click the image and drag it to the preferred location.
- Right-click the image and select Edit Location. Use the Edit Location dialog box to reposition the image.
You can create indicators in the form of a gauge, speedometer, or thermometer to provide a graphical display of the status of a single value of your data.
Prior to creating an indicator graph, ensure that the report palette contains columns that you can use to define goal and threshold levels.
To create an indicator from a report palette:
-
Open and Unlock the report palette.
-
On the report palette toolbar, click the Add Graph icon
.The Select Graph Type
dialog box opens. This is the first step in the graph creation wizard. -
Expand the Indicators tree, select Standard Gauge, Speedometer, or Thermometer, and then click Next.
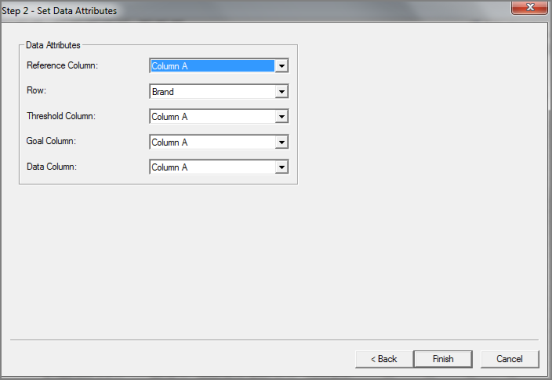
The Set Data Attributes
dialog box opens. -
In the Reference Column box, select the dimension column that contains the value that you are graphing.
-
In the Row box, select the value that you are graphing.
-
In the Threshold Column box, select a column that describes the minimum acceptable value. By default, data values below this level are colored red on the standard gauge and speedometer type graphs. This is not the minimum value in the scale.
-
In the Goal Column box, select a column that describes the maximum value in the expected range. By default, data values above this level are colored green on the standard gauge and speedometer type graphs. This is not the maximum value in the scale.
-
In the Data Column box, select a column that contains the current metric. This is represented by the position of the needle or the height of the thermometer fluid.
-
If you want to further customize the graph, click Graph Options. Otherwise, click Finish to view the graph. For more information, see Selecting Graph Options.
To reposition the indicator:
- Click the indicator and drag it to the preferred location.
- Right-click the indicator and select Edit Location. Use the Edit Location dialog box to reposition the indicator.
To resize a graph, place the pointer on a corner until the resize arrow appears. Press and hold the mouse button and drag the graph frame to the wanted size.
To delete an image, indicator, or spider graph, right-click it, and then select Delete.