What Is a Gantt Chart?
A Gantt chart is a type of time-based graph that displays stacked bars to illustrate project schedules and dependencies. ![]() Example
Example
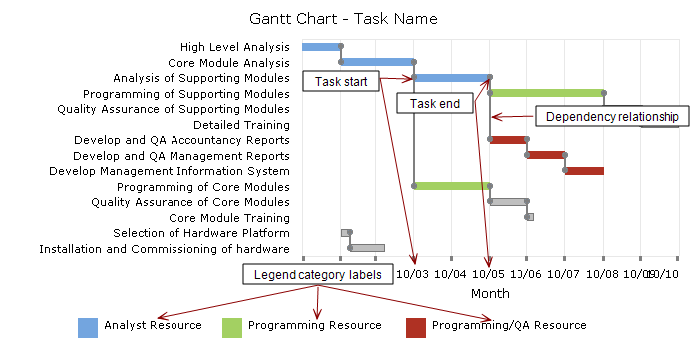
To generate this type of time graph, your cBase or model must have data components similar to the following:
- A Task dimension that contains a list of task names
- Two summaries: Task Start and Task End (dates or numbers)
The following optional components are often included:
- Dependency Info Field—Lists a task that must be completed before this task can begin. Dependency relationships appear on the graph as vertical lines that connect a task end time with its dependent task start time.
- Legend Info Field—Defines labels that appear on the legend. When defined, tasks related to the info field are color-coded on the graph. Tasks that are not associated with a category appear gray. In the above
 example, the graph shows when team resources need to be available, which enables a program manager to plan accordingly.
See also Generating a Time Graph.