You can view a graph in two modes:
- Locked: When a graph is locked, you can perform ProDiver operations, such as sort, flip axes, focus, and dives.
- Unlocked: When a graph is unlocked,
 edit tools are available for you to modify the graph.
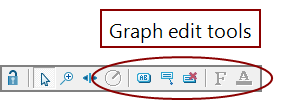
- Graph toolbar—Edit tools are enabled when the graph is unlocked.
- Title—Default is the dimension value of the current dive.
- Legend—Default values are the selected column names.
- Axes labels—Dimension values or numeric scales.
- Axes titles—Default values are column labels.

![]() example, clicking a bar on a bar graph selects the bar object (the label appears bold), and updates the Console History. Double-click
example, clicking a bar on a bar graph selects the bar object (the label appears bold), and updates the Console History. Double-click

When a graph is unlocked, clicking an object selects the area of the graph on which you clicked. Double-click an object on the graph to open the Graph Object dialog box, which you can use to modify the graph format.


NOTE: If data labels overlap and are difficult to read, resting the pointer on a label brings the label to the foreground making it clearly legible.
See also: