When you create a graph, it opens in locked mode by default. When in locked mode, you can use the first four options on the graph toolbar to select graph objects, zoom, scroll, and perform ProDiver functions such as diving. You can unlock the graph to access editing capability that you can use to alter the graph. You can add labels or tags, select data on which to focus, or change font properties.
To unlock the graph, click the Unlock icon ![]() , located on the top left of the dive window.
, located on the top left of the dive window.
When the graph is unlocked, graph edit tools become available.
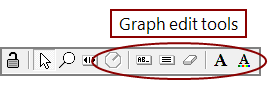
Placing your pointer on an graph toolbar icon produces a tooltip description of the tool function.
| Icon | Description |
|---|---|
|
|
Lock/Unlock Toggles the graph between locked and unlocked modes. |

|
Select Tool Click to return the graph to select mode from zoom mode or scroll mode. When an unlocked graph is in select mode, you can click a data object and dive further. |

|
Zoom Tool Click to enter zoom mode on an unlocked graph. The cursor changes to a magnifying glass. Click anywhere in the graph area to zoom in on the data. Right-click to zoom out. NOTE: When the horizontal axis is densely populated, the labels can be hidden or difficult to read. The labels can appear when you zoom in. |

|
Scroll Bar Click to enter scroll mode. When you zoom in on a graph, only a portion of data is visible on the graph. You can use the scroll tool to peruse data that is currently off-screen. |

|
Radius Tool (Available for Maps only.) Use to select a circular area on a map.
|

|
Create Label Click to add an annotation to the graph. The cursor changes to the Create Label icon. Click the area of the graph where you want to add the NOTE: If you scroll the graph, the label does not scroll with it. The label font is set on the Graph Options dialog box, Text tab. The tool remains selected until you right-click to release it, or select another tool.
|

|
Create Tag Click to add a tag to the graph. The cursor changes to the Create Tag icon. Click the graph object that you want the The tool remains selected until you right-click to release it, or select another tool.
NOTE: This option is not available for a map graph. |

|
Delete Label/Tag Click to delete a label or tag from the graph. The cursor changes to the Delete Label/Tag icon. Click the tag or label that you want to delete. The tool remains selected until you right-click to release it, or select another tool. |

|
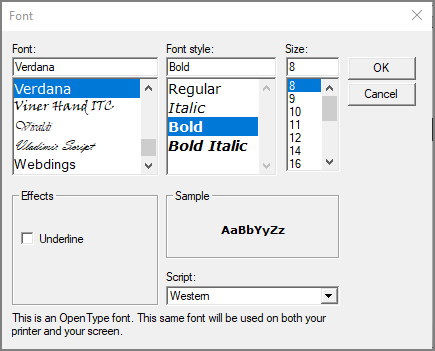
Font Opens the Font
NOTE: To change font on an annotation label, use the the Graph Options dialog box, Text tab. |

|
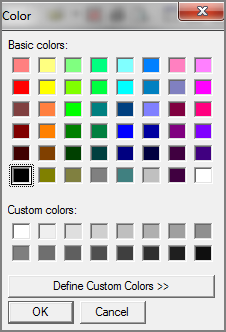
Font Color Opens the Color
|


See also: