Generating a Stack Plot Graph
Stack plot graphs are bar graphs that display summary values in a stacked format. The bar shows individual values as well as the total of all values.
To convert the contents of an active dive window to a stack plot graph:
-
On the toolbar, click the Graph icon
 .
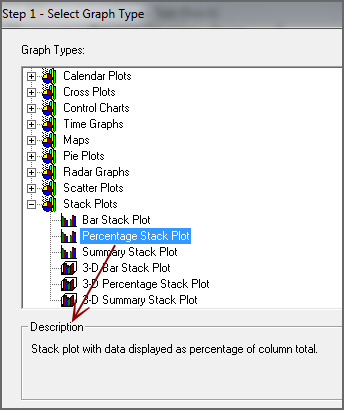
.The Select Graph Type
 dialog box opens. This is the first step in the graph creation wizard.
 TIP: Click a graph type to see a description in the Description box.
-
Double-click the stack plot graph type that you want to create.
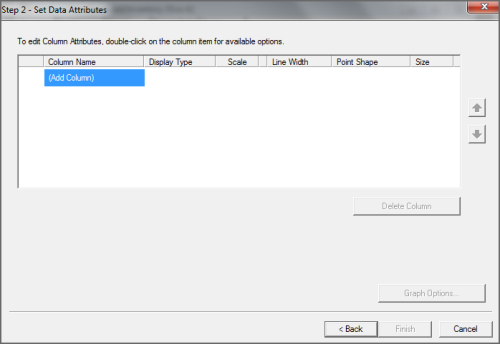
The Set Data Attributes dialog box opens. The data attribute options vary, depending on the selected graph type.
-
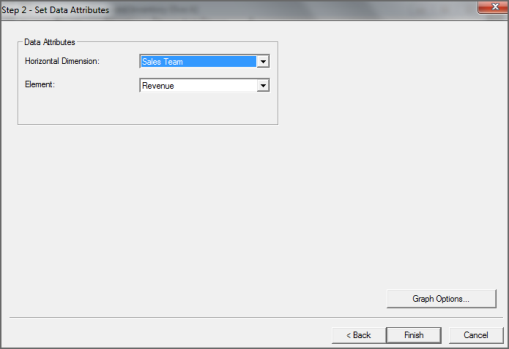
Do one of the following:
-
Select a Horizontal Dimension from the list.
TIP: Choose a dimension with a small number of values. Otherwise, the graph will be difficult to read.
-
Select a summary from the Element list.
-
Proceed to step 11.
-
To add summary columns that you want to appear on the stack graph, double-click Add Column.
A list of available columns appears. You can select up to a total of 16 columns.
-
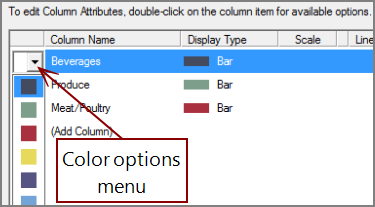
If you want to change one or more colors that display data on the graph, double-click the
colored box in the left column, and select a different color from the list. -
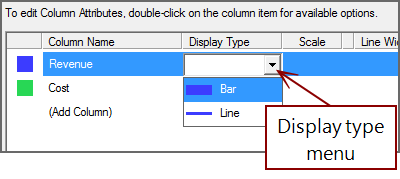
If you want to change the display type for one or more columns, double-click an
item in the Display Type column, and select a different type from the list. -
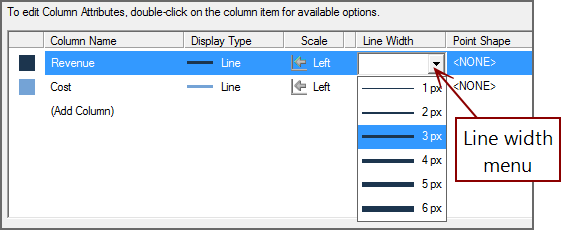
If you are generating a line graph, you can change the line width by double-clicking the setting in the Line Width
column, and selecting a different width. -
If you want to further customize the graph, click Graph Options. Otherwise, click Finish to view the graph.
For more information, see Selecting Graph Options.