This topic describes how to enhance the significance and readability of a column of numbers using the exception reporting options. It begins by creating a simple MultiTab dive window, converting the window using a default report style, and then configuring options in the Edit Item, Exception dialog box.
Complete the following steps:
-
Select a server with a project that contains a sales model with dimensions and summaries, such as:
- Supplier, Brand, and Ship Month
- Cases, Revenue, and Cost
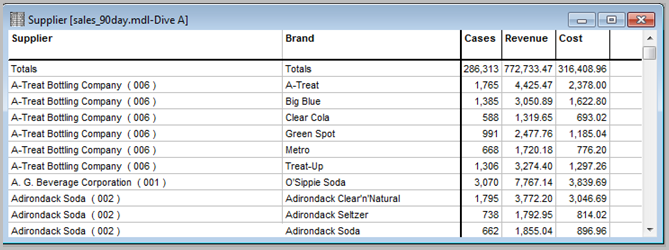
For illustration purposes, this procedure refers to a sales model called sales_90day.
-
In ProDiver, locate and open sales_90day.mdl.
-
On the Console, double-click Supplier to open a basic tabular dive window.
-
Click the MultiTab icon.
-
On the Console, double-click Brand to open a
 MultiTab dive window.
 -
Click the Report icon to open the
Default Report dialog box. Perform the following actions: -
Select Indented 2 Level MultiTab as the Report Style.
-
If selected, clear the Gridlines check box.
-
Click OK to display the sample MultiTab report.
-
Click the Lock icon to unlock the report.
-
Right-click the Revenue column, and select Edit Item to open the dialog box with the Exception tab.
-
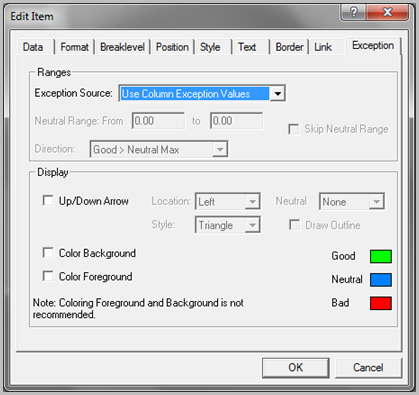
Click Exception to open the Edit Item, Exception
dialog box. -
To populate the Revenue column with Good, Bad, and Neutral indicators:
- Set the Exception Source option to Define Range Below.
- Set the Neutral Range From 1000 to 3000.
- Clear the Skip Neutral Range option.
- Set the Direction to Good > Neutral Max.
- Select the Up/Down Arrow option.
- Set the Location to Right and the Style to Arrow.
- Set Neutral to None.
- Select the Draw Outline option.
- Select the Color Foreground option.
-
Click OK to
display the report with revenue column indicators.

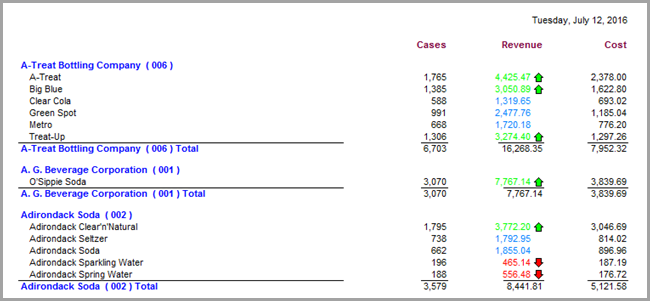
Notice that the Good revenue values appear in green with an up-arrow indicator. Bad values appear in red with a down-arrow indicator. Neutral values appear in blue without an indicator.