Adding Tabular Columns
-
-
The Add Column
 dialog box opens.
 -
In the Column Name box, enter a name for the column.
NOTE: When assigning a column name, be sure that you do not duplicate an existing column name. Use alphanumeric or underscore characters only. Other characters can adversely affect calculations.
-
If you want the column label to be something other than the column name, select Label is different from name.
A text box appears adjacent to Label is different from name. Enter the label that you want to appear on the dive window column heading. This label can include characters that are not allowed in the column name. If you enter $(<QuickView_name>), the QuickView value appears as the label.
NOTE: The column label is used in reports and graphs that are generated from the tabular display. However, you must use the column name for other types of references, such as calculation and time-series references.
-
In the Definition box, enter a calculation whose result you want to display in the column. You can enter the calculation syntax directly in the box, or click column names, symbols, and math operators on the window to create the calculation. You can also use a Spectre-language calc.
If you are entering calculations in the Spectre language, you must enclose the expression in backticks. For example:
`filter( dimcount ("OrderNbr"), value("DeliveryDate") = today() )`
In this
example, the calculation was created by clicking Total, Revenue, the minus operator, and Cost.For more information, see Tips for Defining Column Calculations.
The Other Columns box lists calculations that were created previously, if there are any.
-
In the Model Columns section, you can specify a
column type and summary to be used in the new column. - Under Info Columns, you can also select info fields that you want to include.
- In the Calcs section, you can select additional summary columns to include.
-
Below the list of info fields
NOTE: The value of the count is determined by your Diver developer and is specific to the cBase
- In the Functions area, you can select mathematical functions to use in the calculation.
- Click OK to close the Add Column window.
-
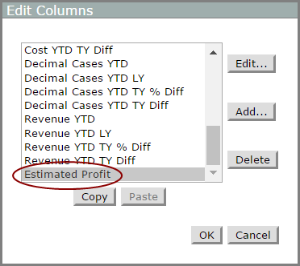
In the Edit Columns
window, the new column appears at bottom of the list. - Click OK to close the Edit Columns window.
- The new column is added to the dive window.