NetDiver Graph Formats
You can view your data in various graphical formats. The best type of graph to use depends on the data being presented.
Basic Plot Graphs
Basic plot graphs display data for a single dimension and up to 16 summaries. They consist of a series of plotted points that correspond to summary values being displayed. Basic plot graphs include bar graphs, line graphs, and point graphs. The following styles of basic plot graphs are available:
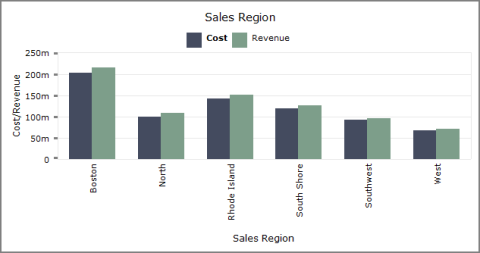
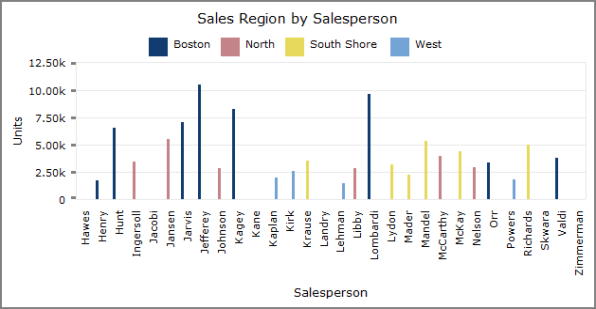
Bar Plot Graph ![]() Example
Example
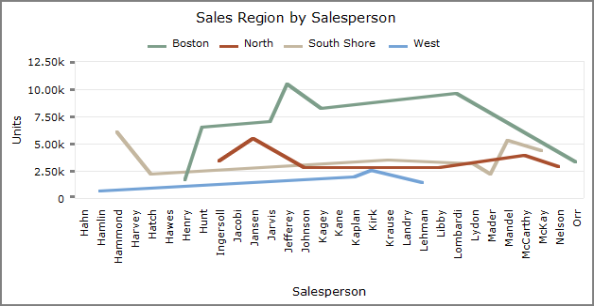
Line Plot Graph ![]() Example
Example

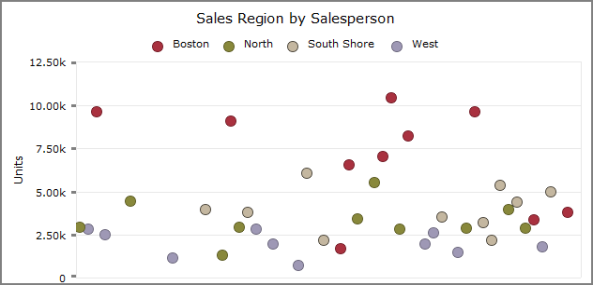
Point Plot Graph ![]() Example
Example

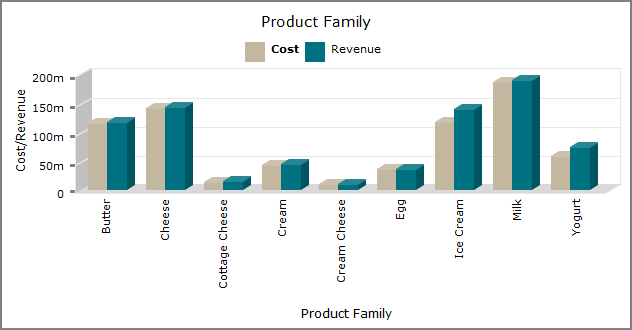
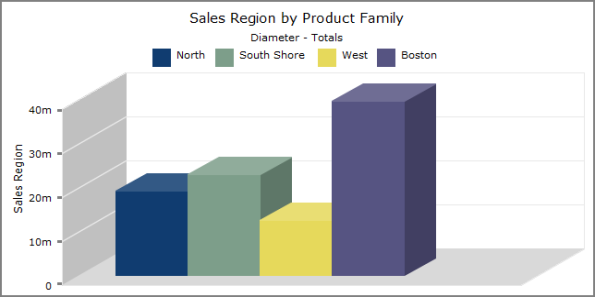
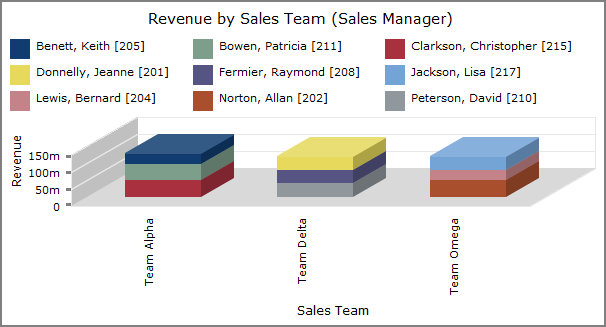
3-D Bar Plot Graph ![]() Example
Example
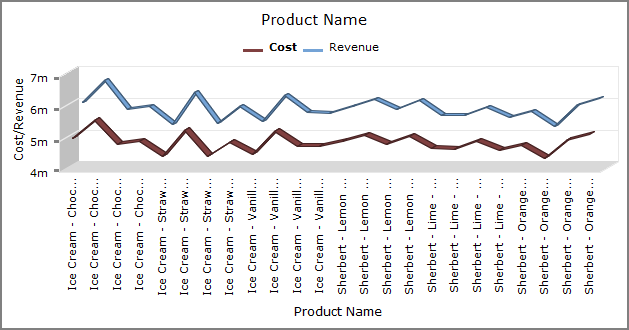
3-D Line Plot Graph ![]() Example
Example
Pie Plot Graphs
Pie plot graphs display up to 16 values for a single dimension. If there are more than 16 values, the graph displays the first 15 values listed in the tabular display, and combines the remaining values in a 16th wedge called Other. The following styles of pie plot graphs are available:
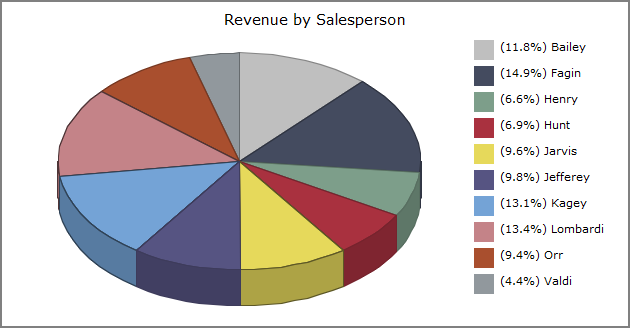
Pie Plot Graph ![]() Example
Example

3-D Pie Plot Graph ![]() Example
Example
Cross Plot Graphs
Cross plot graphs shows data that pertains to two dimensions simultaneously. The following styles of cross plot graphs are available:
-
Bar Cross Plot
 Example
 -
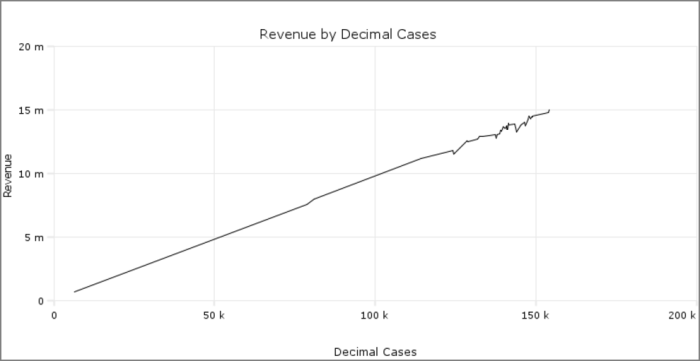
Line Cross Plot
ExampleNOTE: If there is only one value, instead of a line, the graph displays a dot.
-
Point Cross Plot
Example -
3-D Bar Cross Plot
Example -
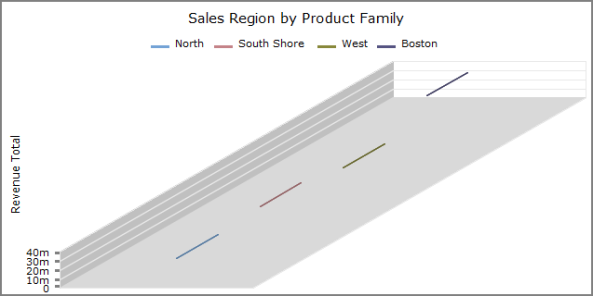
3-D Line Cross Plot
Example
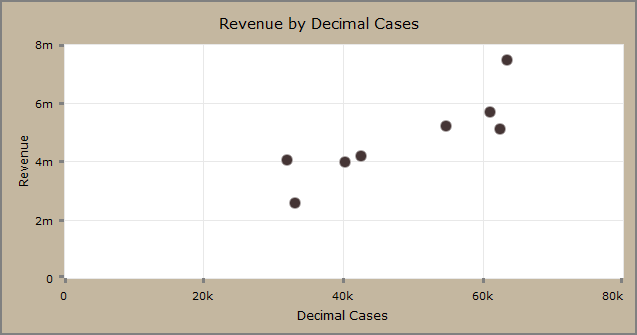
Scatter Plot Graphs
Scatter graphs display data for two summaries across a single dimension. The following styles of scatter graphs are available:


Stack Plot Graphs
Stack plot graphs display summary values in a stacked format. The following styles of stack plot graphs are available:

Mentioned in: