Tabular Display Features
Basic Tabular, MultiTabular, CrossTabular, and MultiCrossTabular displays share the following features:
-
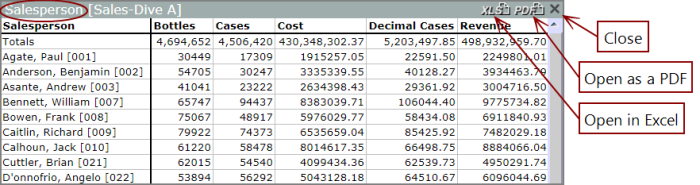
Dive Window layout—The upper left of the dive window displays the name of the dimension that you are diving on. The upper right of the dive window has icons that you can use to open the current data in Microsoft Excel, view the data as a pdf file, and close the dive window.
-
Scroll bars—The dive window has vertical and horizontal scroll bars as needed. Columns to the right of the
-
Rows and Columns—
-
The topmost rows contains column headings.
-
The Totals row directly under the
NOTE: If you are using the focus option, this row shows Subtotals of the focused data. If you are using the group option, this row shows the Group totals.
-
The leftmost columns use dimension values for the current dive as row labels.
-
The remaining row cells contain summary data.
- Selected rows are indicated by a highlight on the row label. Selected columns are indicated by a highlight on the column heading. Selected data cells are highlighted along with the column and row labels.
-