About Trellis Charts
A trellis chart displays a series of subcharts that use the same scale and axes. They are used for comparisons.
Trellis chart subcharts can be either multivalue or multitab types:
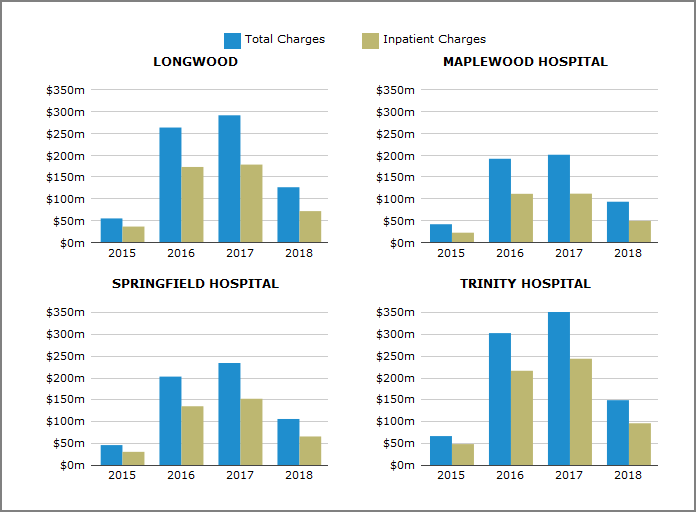
- Multivalue subcharts are area, bar, spline area, column, histogram, line, sparkline, and spline charts. You can specify more than one value. In the example above, each subchart (facility category) shows two values (total charges and inpatient charges) for each discharge year (dimension).
-
MultiTab subcharts are MultiTab area, MultiTab spline area, MultiTab stacked area, MultiTab bar, MultiTab column, MultiTab stacked bar, MultiTab stacked column, MultiTab line, MultiTab sparkline, and MultiTab spline charts. You can specify one value only. Instead of a second value, you specify a group dimension.
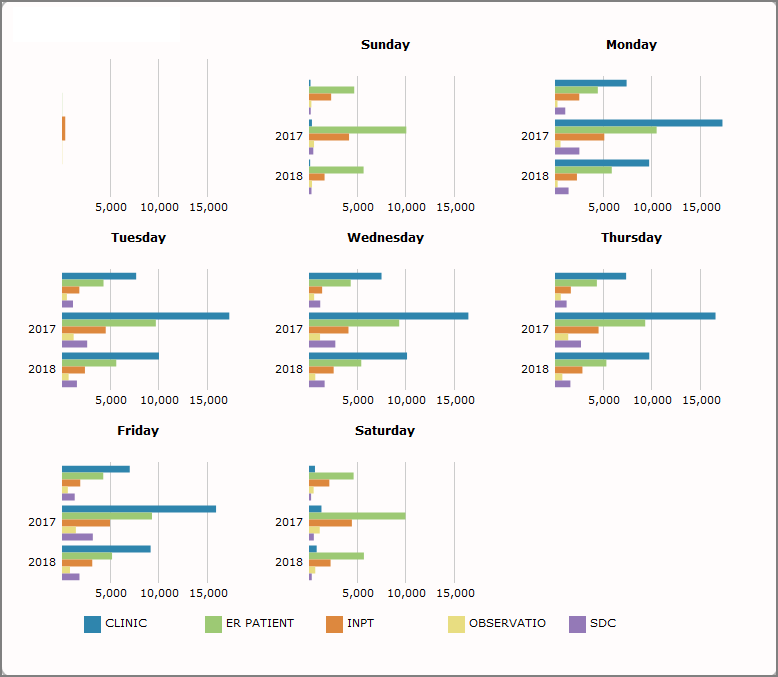
In the example above, each subchart (day category) shows the number of discharges value, broken down by the patient type (group) and discharge year (dimension).
Trellis charts with a MultiTab subchart can use either a cBase, cPlan, Factory, 3-dimension Spectre Dive file, or 3-dimension MultiTab marker as a data source. When this occurs, the dimension, category, and group value selections occur automatically as defined in the source.
Trellis chart options
Depending on the type of subchart, when you create a trellis chart, you specify:
- A subchart type (Column is the default setting)
- A dimension (major axis)
- A subchart category
- One or more numeric values (minor axis)
- A group dimension (Multitab subcharts only)
Optionally, you can customize the color and label for each value, and show the mean and median values.
Axes settings allow you to alter the horizontal label and vertical scale. You can use legend settings to change the appearance of the legend.
Reading a trellis chart
Placing a pointer on a subchart data visualization opens a tooltip that shows the details about the associated data. The legend defines the specified values on a multivalue chart or group values on a MultiTab chart.
See also Chart Portlet Options.