About Treemaps
A treemap displays hierarchical data as a set of nested tiles. The size of each category is determined by the total values of its combined dimensions, and the size of each tile is determined by the dimension value in a part-to-whole relationship. Treemaps are useful for showing MultiTab data, especially relative magnitude values, and can show a significant amount of tiles without taking too much screen space.
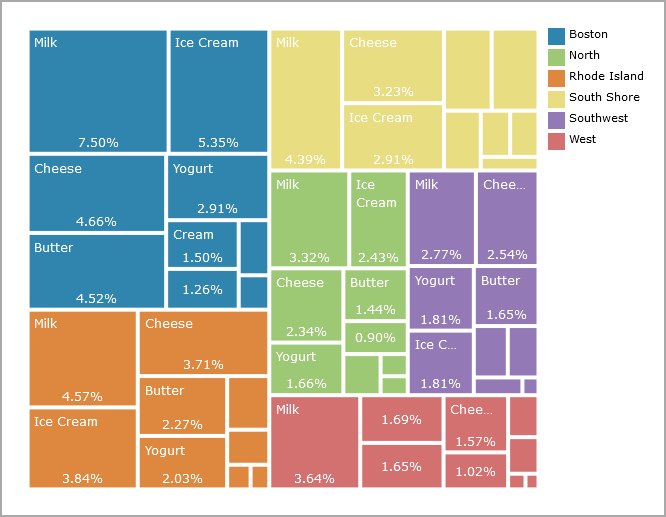
The following chart shows product (dimension) sales by region (category).
Treemap options
When you create a treemap, you specify:
- A dimension
- A category
- A numeric value column
Legend settings include customized colors.
You can show every tile, or specify how many tiles to display per category, and then group the others.
Reading a treemap
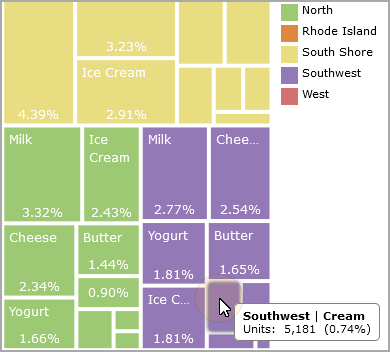
Small tiles are not labeled, but placing a pointer on a tile opens a tooltip that shows the details about the data.
See also Chart Portlet Options.