About Sankey Diagrams
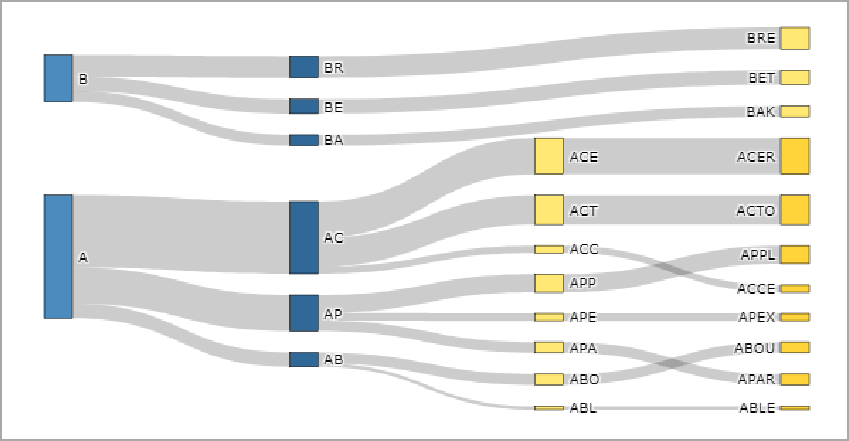
Sankey diagrams emphasize the major transfers or flows within a system. They are useful in science and engineering to represent heat balance, energy flows, and material flows as well as life-cycle assessment of products.
Sankey diagrams visualize dominant contributors or consumers and show relative magnitudes. The flow is broken into stages, which are separated by nodes. The thickness of the horizontal lines between stages represent the proportional value of the flow.
Sankey diagram options
When you create an Sankey diagram, you specify:
- A source column
- A target column
- A numeric value column
Reading a Sankey diagram
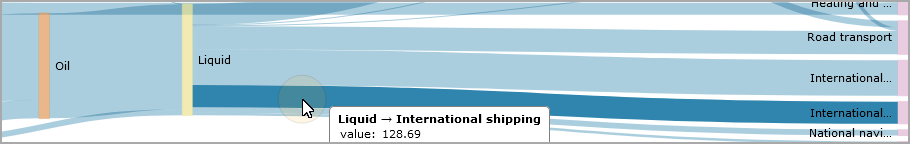
The thickness of the vertical flow lines indicates the relative quantity.
Placing a pointer on a flow line opens a tooltip that shows the begin and end nodes as well as the summary column value.
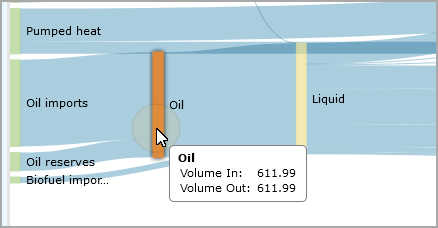
Placing a pointer on a node opens a tooltip that shows the node, volume in, and volume out values.
See also Chart Portlet Options.