About Mosaic Charts
A mosaic chart is a rectangular array of tiles. The size of each tile is determined by the value of a specified dimension. They are useful for showing MultiTab data, especially relative magnitude values.
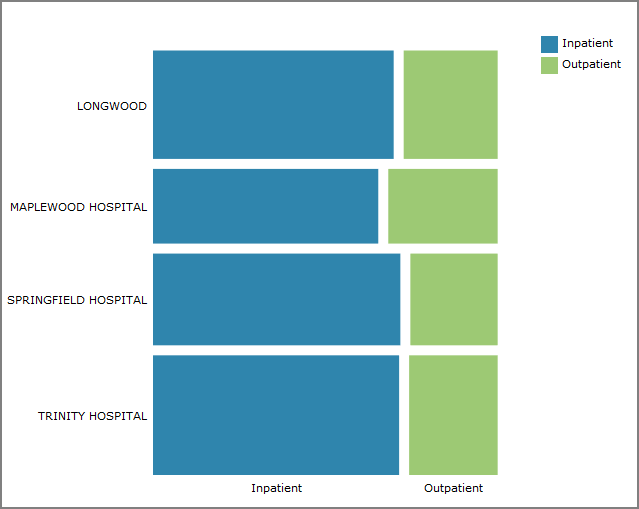
Mosaic chart options
When you create a mosaic chart, you specify:
- A horizontal X dimension
- A vertical Y dimension
- A numeric value column
Optionally, you can specify vertical or horizontal alignment for the chart, as well as a time range.
Legend settings include customized colors.
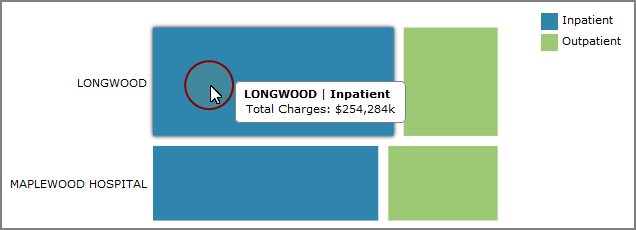
Reading a mosaic chart
Placing a pointer on a tile opens a tooltip that shows the details about the data.
See also Chart Portlet Options.