About Heatmatrix Charts
Heatmatrix charts use color on a matrix layout to show data values. They are useful for showing MultiTab data, especially ratios.
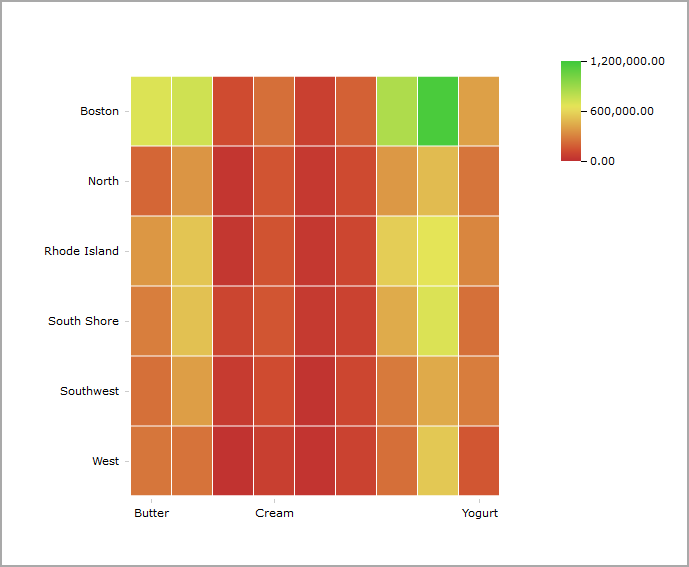
Heatmatrix chart options
When you create a heatmatrix chart, you specify:
- A horizontal category
- A vertical dimension
- A numeric value column
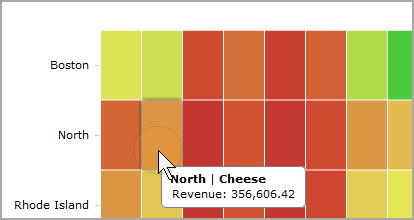
Reading a heatmatrix chart
Placing a pointer on a tile opens a tooltip that shows the details about the data.
See also Chart Portlet Options.